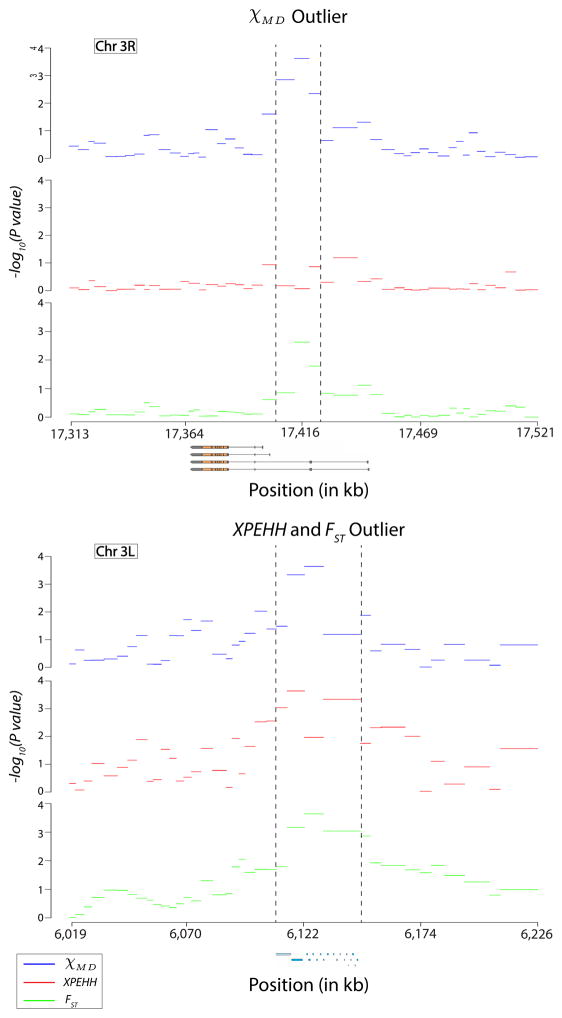
Figure 12.
The top outlier regions and flanking windows for the empirical analysis of χMD, XP-EHH, and FST are shown. Above, the χMD outlier resides within a transcript region of the insulin receptor gene (InR alternative transcripts are shown). Below, XP-EHH and FST reached their maxima in the same outlier region (at adjacent windows), within a cluster of cuticle-related genes.

