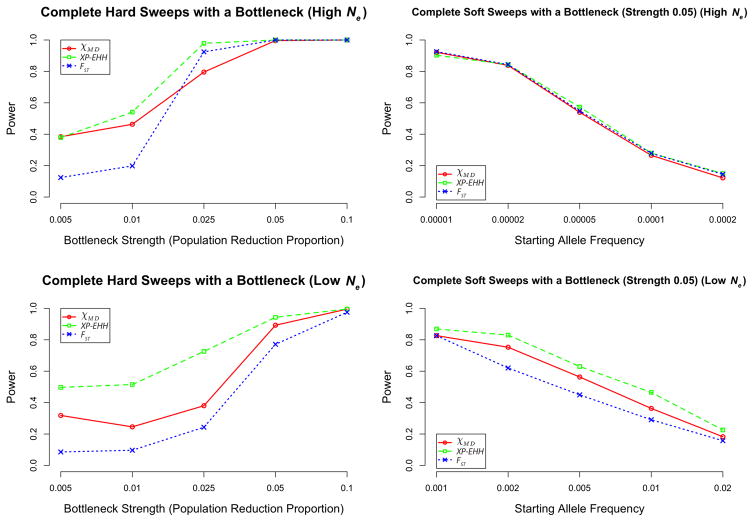
Figure 5.
Depicted here are power for scenarios with bottlenecks simulated. The left panels depict hard sweeps, with varying strengths of bottlenecks indicated on the x axis. The right panels depict a single bottleneck strength (0.05) with varying starting allele frequencies. Additional cases are summarized in Table S5.

