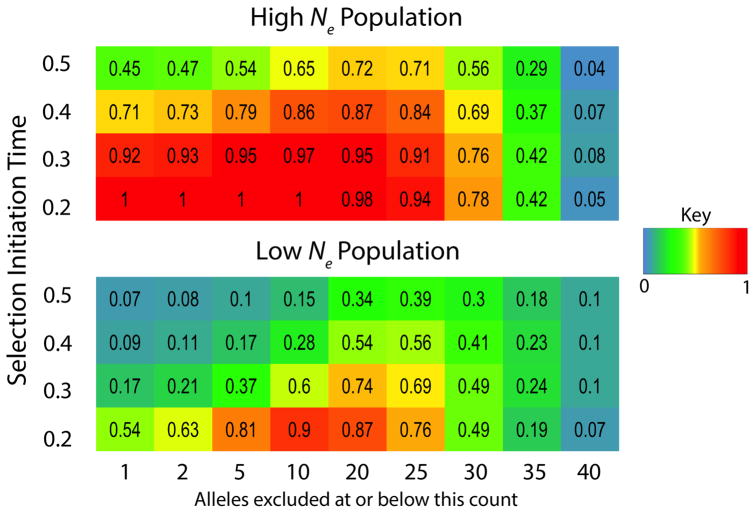
Figure 7.
This heat map depicts power of the χMD statistic as a function of allele frequency threshold (minimum frequency of allele to be included in analysis) and the time (in coalescent units) since the initiation of a complete hard selective sweep. The exclusion of all but intermediate frequency alleles yields surprising power to detect very ancient sweeps.

