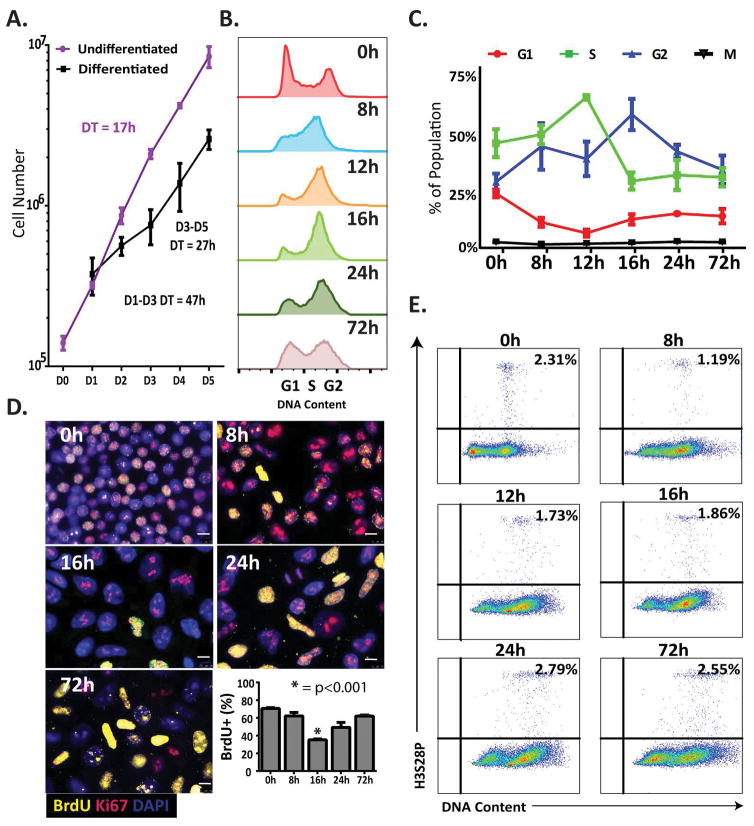
Figure 1.
Human embryonic stem cells (hESCs) induced to differentiate into mesendoderm pause in G2. (A) Growth Curves for hESCs under pluripotent and differentiation conditions. Line graph represents mean±SD from three independent experiments. (B) Representative flow cytometric analysis of DNA content by DAPI staining over a differentiation time course. Note the accumulation of cells in G2 between the 8h and 24h time points. (C) Percentages of cells in each phase (G1, S, G2, and Mitosis) at each time point during mesendoderm differentiation, as determined by cell cycle profile analysis using ModFit (G1, S, and G2 phases) and FlowJo (M phase, by determining the expression of H3S28P) software. Data represents the values for three replicates; data represents mean±SD. (D) Representative immunofluorescence images showing BrdU (yellow), and Ki67 (red) at time points indicated. Nuclei are stained with DAPI (blue) (scale bars: 10 μm). Quantification of BrdU+ cells was performed using blind scoring in duplicate of 200 cells, data represents mean±SEM (*, p < 0.001). (E) Representative flow cytometric analysis during differentiation time course shown as H3S28P vs. DNA content with the percentage of mitotic cells indicated in the upper right corner.

