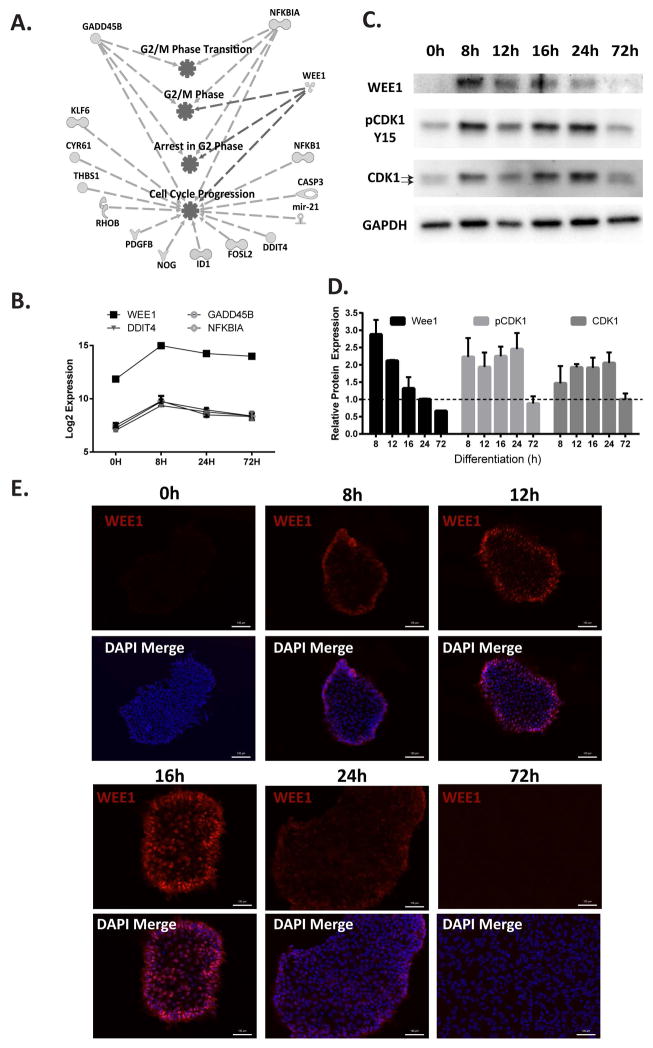
Figure 4.
WEE1, a G2/M regulator, is up-regulated during the G2 cell cycle pause. (A) Using Ingenuity to analyze Cluster 2, genes were pulled out that were related to cell cycle progression/regulation, and associated genes were mapped. (B) Expression profiles of the four known regulators of G2 phase progression. The graph shows microarray expression levels as log2 values. Data represents mean±SD from three independent experiments. (C) Representative Western blot showing the levels of WEE1, pCDK1 Y15, and CDK1 in hESCs induced to differentiate to mesendoderm. GAPDH is used as a loading control. The two arrows indicate the separation between the phosphorylated and unphosphorylated states of CDK1. (D) Quantification of Western blots represented in (C). Quantification data is the mean±SD from two independent experiments. (E) Representative immunofluorescence images with WEE1 (red). Nuclei are stained with DAPI (blue) (scale bars: 100 μm).

