Figure 3.
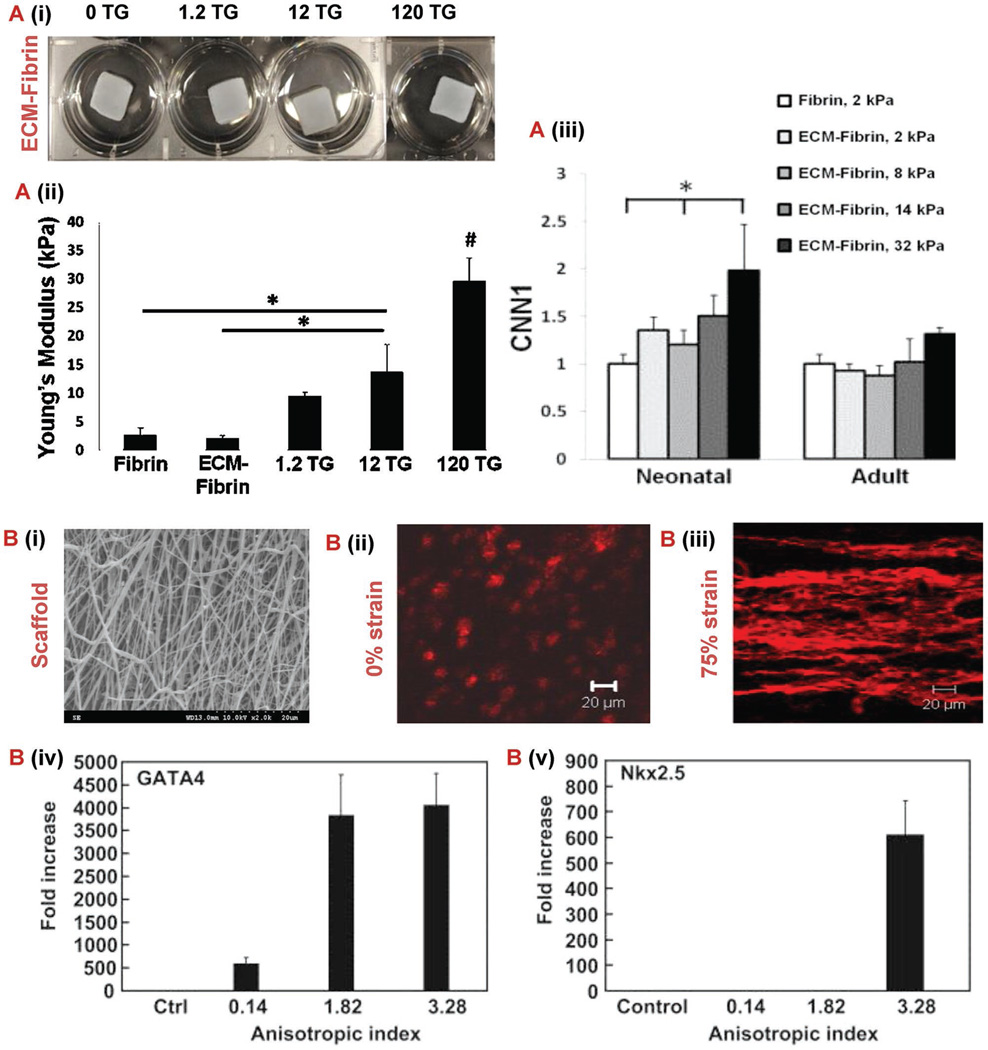
Mechanobiology to control stem cell. A) Characterization of ECM-fibrin gels with varying concentrations of TG.[101] (i) Young’s modulus of gels produced by uniaxial testing. (ii) Swelling ratio. (iii) Cardiovascular gene expression of smooth muscle marker CNN1 and endothelial in gels with either neonatal ECM or adult ECM 21 d after cardiac progenitor cell seeding. B) (i) Anistroic fiber morphology shown in 2000× SEM micrograph of poly(ester carbonate urethane) electrospun scaffold.[123] (ii, iii) Z-stack confocal images of tissue constructs at different strains (0% and 75%). Rhodamine phalloidin was used to stain F-actins of the cells. Scale bar: 20 µm (iv, v) Real time RT-PCR analysis of cardiac specific genes GATA4 and Nkx 2.5. Control group represents the gene expression of MSCs culture on tissue culture plates. Control group values were used for normalization. Abbreviations: SEM, scanning electron microscopy; RT-PCR, reverse transcription polymerase chain reaction; TG, transglutaminase; ECM, extracellular matrix; CNN1, calponin 1.

