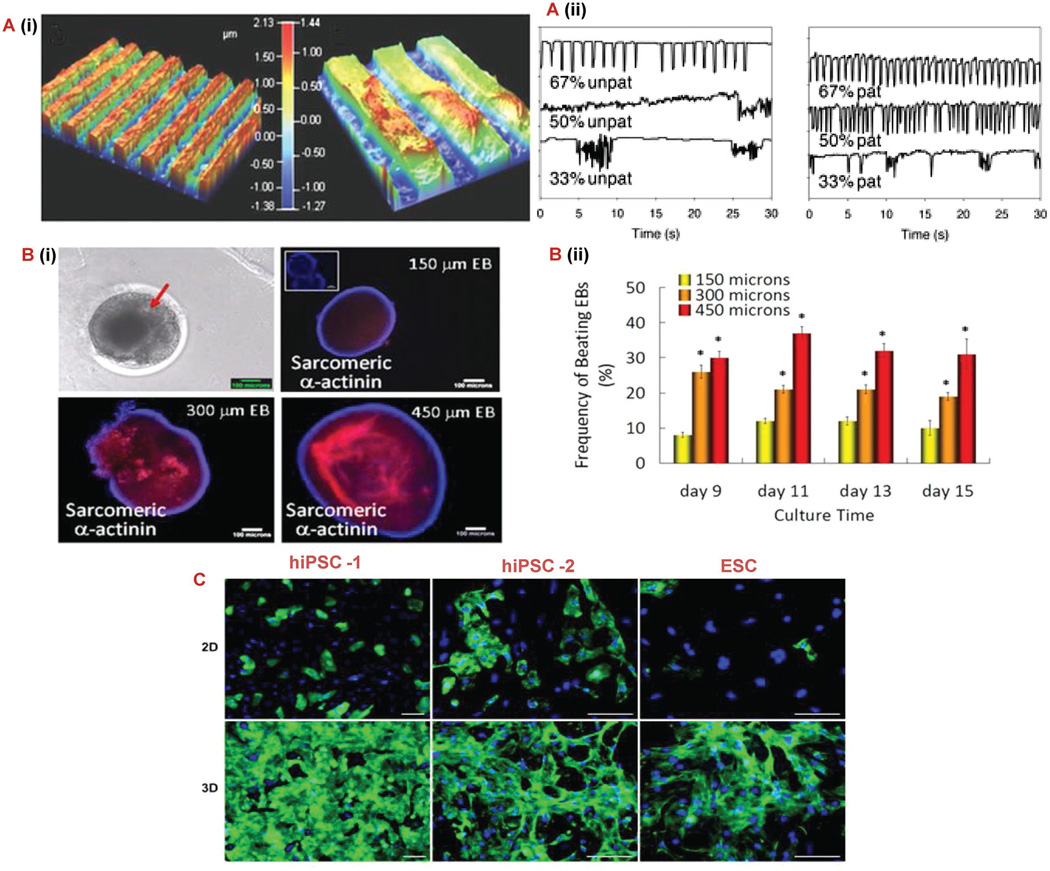
Figure 4.
Microscale techniques for controlling stem cell behavior. A) (i) Optical profilometry of patterned 67% PD gelatin hydrogel. A) (ii) Cardiomyocyte beating characteristic of unpatterned and patterned gelatin gels at varying PD concentrations. Pixel intensity was used to monitor the gels over a 30 s period [131] B) (i, ii) Morphology of beating EBs, immunocytochemical characterization of cardiomyogenic differentiation identified by sarcomeric α-actinin and evaluation of beating EBs cultured in microwells. Inset for 150 µm EB figure indicates control stained only with secondary antibody. Scale bar: 100 µm.[133] C) Immunostaining for sarcomeric α-actinin (green) and nuclei (blue) of three different pluripotent cell sources harvested from day 21 monolayer cultures and day 7 cardiosphere.[138] Scale bars: 50 µm. Abbreviations: hiPSC, human induced pluripotent stem cell; hESCs, human embryonic stem cell; PD, photodegradable; EB, embryonic bodies.

