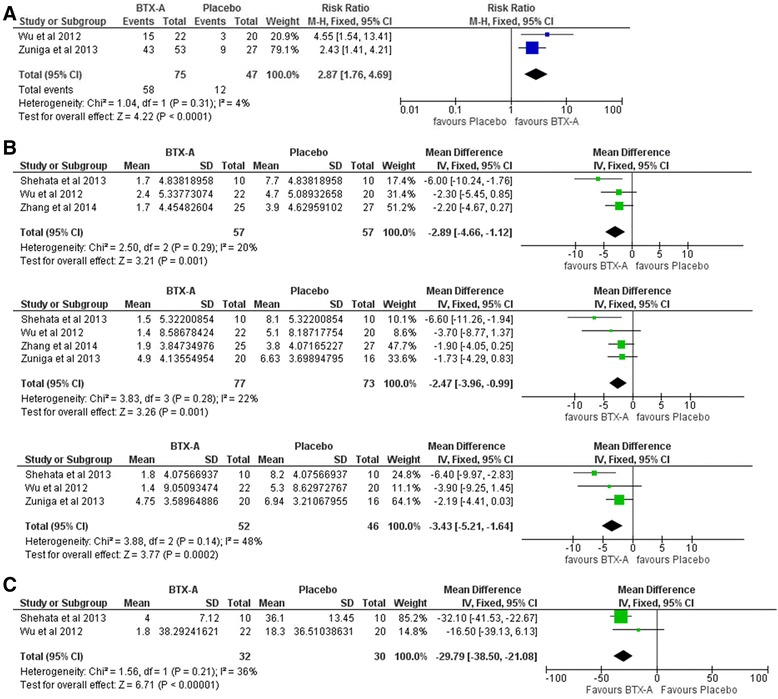
Fig. 3.

A Forest plots of relative risk (RR) for proportion of respondents comparing BTX A with placebo. M-H: Mantel-Haenzel, CI: confidence interval. B Forest plots of mean difference in VAS score comparing BTX A with placebo at the end of follow up (A), 1 month (B), 2 month (C), and 3 month (D). VAS: Visual analogue scale, MD: Mean difference, M-H: Mantel-Haenzel, CI: confidence interval. C Forest plots of mean difference in number of paroxysm comparing BTX A with placebo. MD: Mean difference, M-H: Mantel-Haenzel, CI: confidence interval
