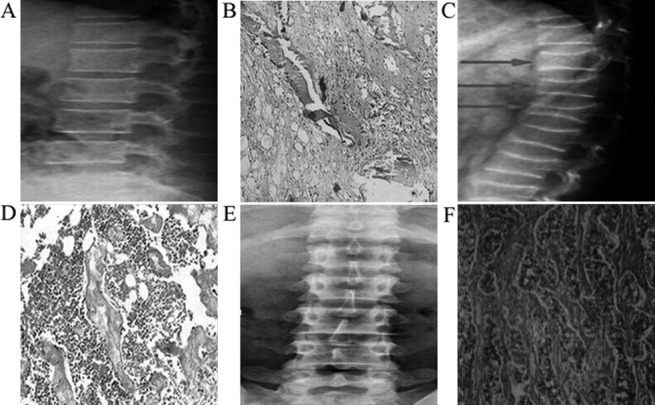
Fig. 1.

(A) Normal lumbar X-ray film. (B) Hematoxylin and eosin (HE) staining of a sample of the normal lumbar spine (300 × 300); (C) Lumbar spine X-ray slice representative of the observation group (arrow, osteoporosis); (D) HE staining of a representative observation group sample (300 × 200); (E) Representative X-ray film of the lumbar spine of the control group; (F) HE-stained sample representative of the control group (300 × 400).
