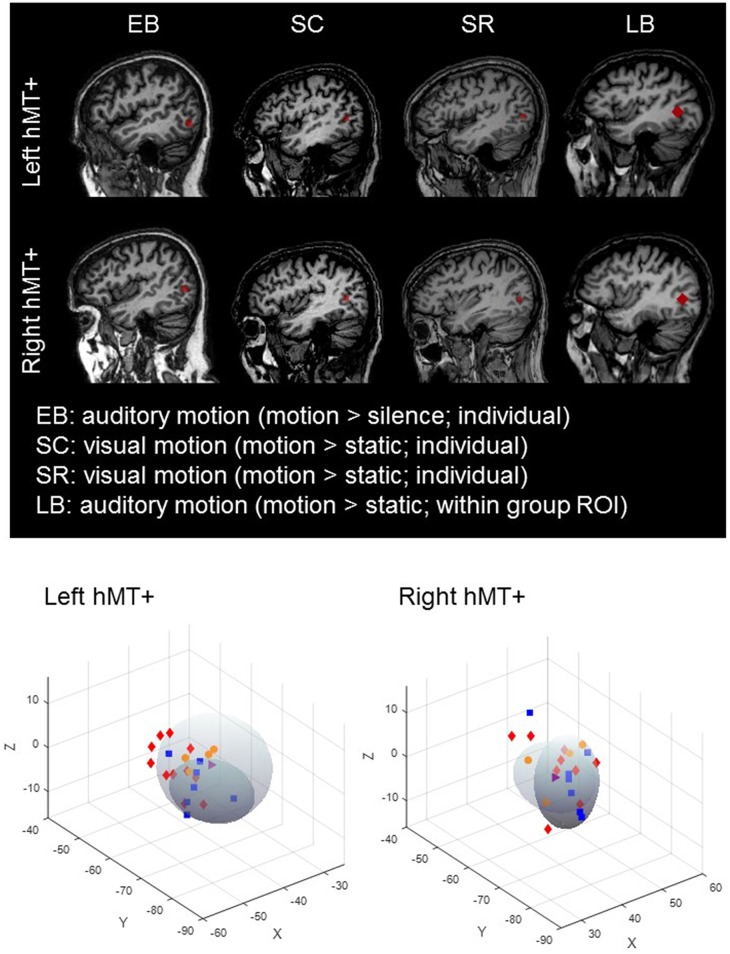
Figure 1.
Top : hMT+ ROIs in a representative early blind, sighted, late blind and sight recovery subject. Bottom: hMT+ ROI centroid co-ordinates for each subject for left and right hemispheres. The darker shaded oval represents the location of hMT+ ± 2SD from Dumoulin et al. (2000) and the lighter shaded oval represents the location of hMT+ ± 2SD from Watson et al. (1993). There was no systematic tendency for any particular subject group to have ROI locations that were systematically misplaced from the expected location of hMT+. SC (red symbols); EB (blue symbols); LB (orange symbols); SR subject (purple symbols).

