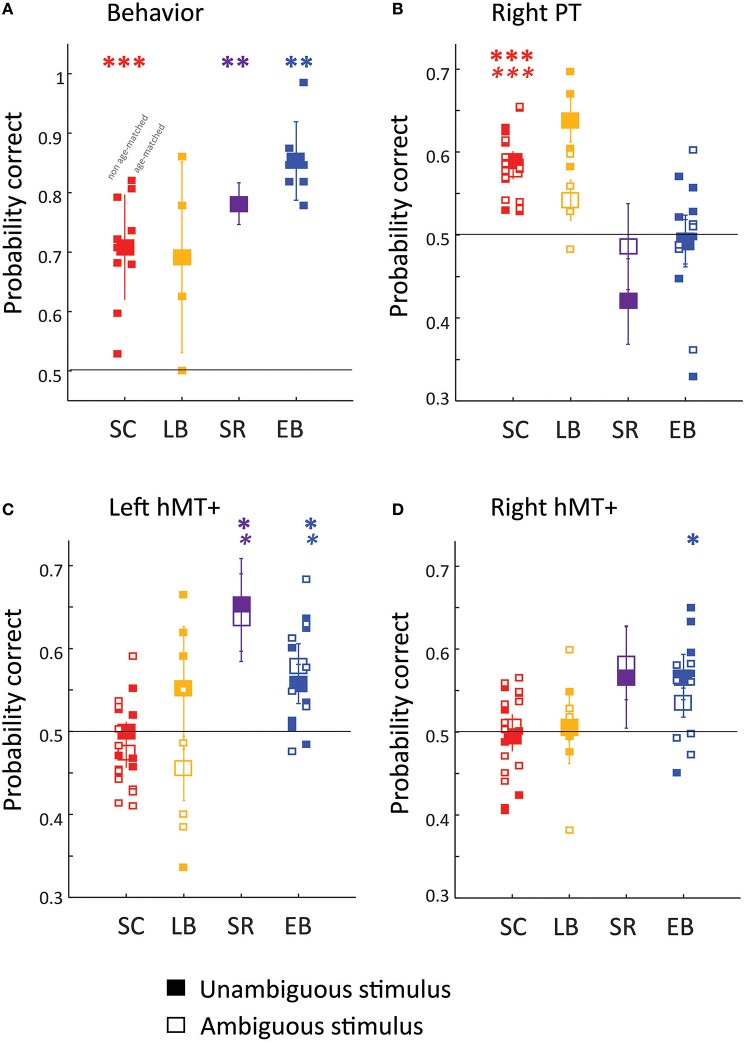
Figure 2.
Behavioral (A) and fMRI pattern classification (B–D) performance. Filled symbols show behavioral (A) and MVPA classification (B–D) accuracy for the direction of the unambiguous motion stimulus (50% coherence). Empty symbols show MVPA classification (B–D) accuracy for the direction of ambiguous motion stimulus (0% coherence). Except in the case of the SR subject large symbols represent group mean performance, with error bars representing the standard error of the group mean, and small symbols representing individual subjects. The subset of EB and SC subjects included in age-matched analyses are shifted to the right. MM is represented with large symbols, with error bars calculated across separate runs. Three ROI's were chosen a priori: (B) rPT, (C) left hMT+, (D) right hMT+. Generally Wilcoxon signed rank tests (one-sided, uncorrected for multiple comparisons) were used to examine whether behavioral or classification performance was significantly above chance (shown with the dashed line) *p < 0.05; ** p < 0.01; *** p < 0.001. For MM MVPA classification significance was estimated using permutation tests. BOLD asterisks represent significance for the unambiguous stimulus. Italic asterisks represent significance for the ambiguous stimuli.

