FIGURE 3.
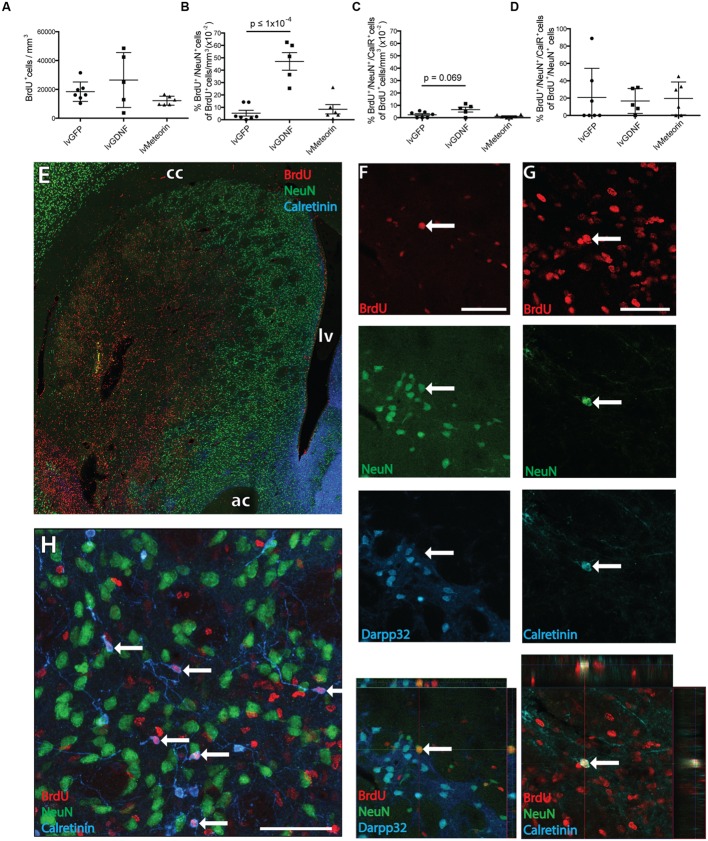
Birth-dating of striatal neurons after quinolinic acid lesion to assess the effect of GDNF and Meteorin on these populations. (A) Quantification of BrdU+ cell density across treatment groups revealed no significant change in newborn cells in the striatum. (B) Quantification of BrdU+ cells co-expressing NeuN across treatment groups normalized to BrdU+ cell density revealed lvGDNF increased the number of new neurons in the ipsilateral striatum, with lvMeteorin having no effect compared to lvGFP controls. (C) Quantification of BrdU+/NeuN+/CalR+ cells normalized to BrdU+ cell density identified lvGDNF treatment trended toward an increase in this population. (D) CalR+ cells normalized to total BrdU+/NeuN+ cells indicated differentiation into this phenotype is altered across all newborn neurons. Overview image of BrdU/NeuN/CalR staining (E) and representative orthogonal z-stack confocal images of immuno-labeled (F) BrdU+/NeuN+/Darpp32- neurons and (G) BrdU+/NeuN+/CalR+ interneurons (arrow). (H) NeuN negative interneurons were also observed as a primary subset of BrdU+/Calretinin+ cells (arrows). Data represents mean ± SEM. lvGFP n = 7; lvMeteorin n = 6; lvGDNF n = 5. Scale bars: 100 μm. cc, corpus callosum; lv, lateral ventricle; ac, anterior commissure; CalR, Calretinin.

