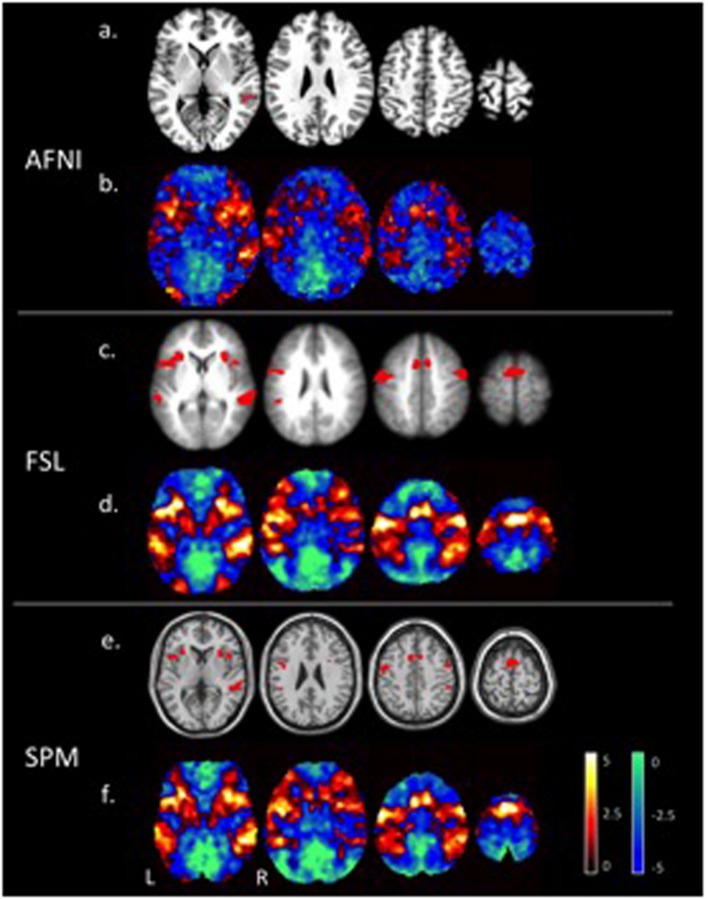
FIGURE 1.
Areas of significant activations (red) for a one-sided t-test at a p ≤ 0.05 FWE corrected cluster-wise threshold for the tone counting contrast (a), (c), (e), and un-thresholded t-statistic maps (positive values in red to yellow and negative values in blue to green) (b), (d), (f), at the group level are compared for each of the three software packages (AFNI, FSL, and SPM).

