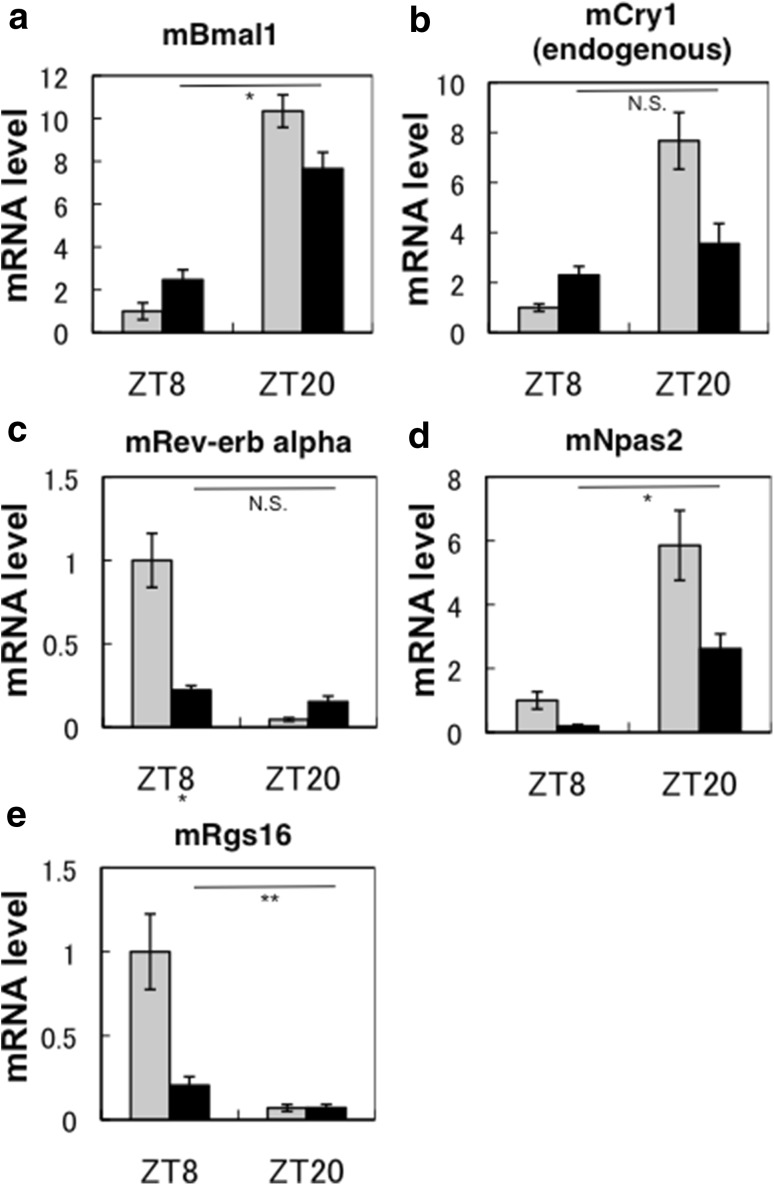
Fig. 3.
mRNA expression levels in the liver. mRNA expression of clock genes in the liver at ZT 8 and ZT 20 in mice (a mBmal1; b endogenous mCRY1; c mRev-erb alpha; d mNpas2; e mRgs16). In each representation (gray bars WTs; solid bars Tg mice), the value for the WTs at ZT 8 was set to 1. The vertical bar attached to each data point represents SE (n = 7–12). Asterisks show that the respective differences in the expression level between ZT8 and ZT 20 in Tg mice are significant (**P < 0.05, *P < 0.00001, t test). N.S. shows that no significant difference exists between ZT8 and ZT 20 (t test). As for WTs, all respective differences in the expression levels between ZT8 and ZT 20 were statistically significant (P < 0.001, t test)

