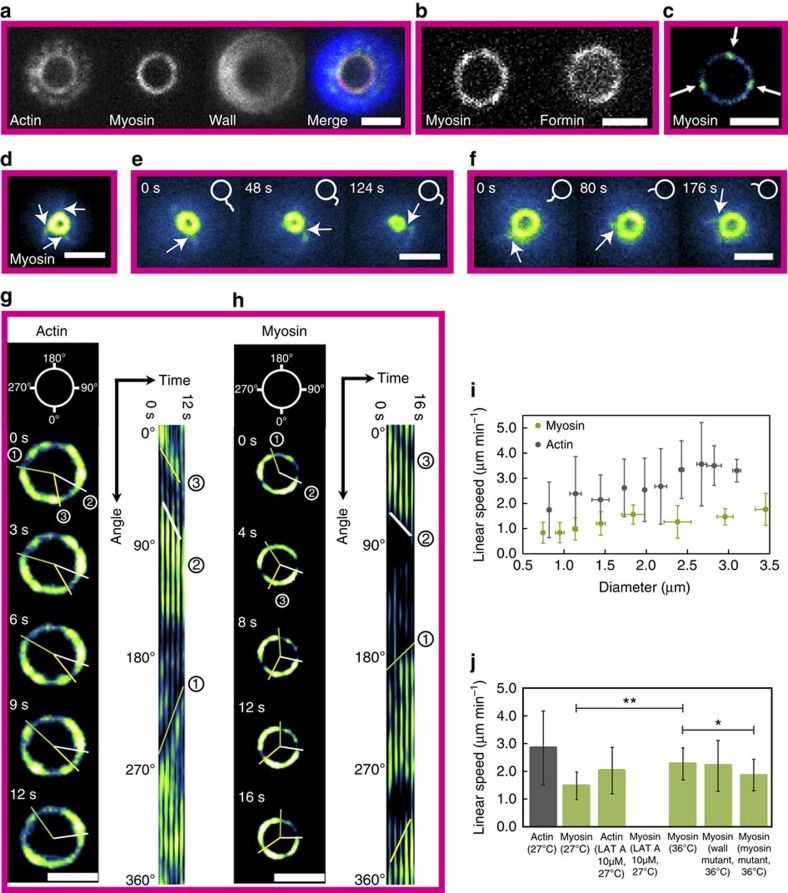
Figure 3. Actin and myosin cluster rotate in fission yeast rings.
(a) The fission yeast cytokinetic ring visualized by actin (CHD–GFP) myosin (Rlc1-tdTomato) and cell wall (calcofluor) labelling. (b) The ring is visualized by myosin and formin (Cdc12–GFP) labelling. Scale bar, 2 μm. (d–f) Representation of arms extending out of a ring (d). Arms attached to the ring (arrows) rotate counter-clockwise (e) and clockwise (f). The rings are visualized by myosin labelling (Rlc1-mCherry). Scale bar, 2 μm. (c,g,h) Representation of clusters (arrows) in the cytokinetic ring visualized by myosin (Rlc1-mCherry) (c). During ring constriction, clusters of actin (CHD–GFP) (g) and myosin (Rlc1-tdTomato) (h) rotate clockwise and counter-clockwise. The analysis is based on a kymograph representation of the ring after polar transformation. Lines highlight the motion of clusters on the ring and in the kymographs. Scale bar, 2 μm. (i) The analysis of cluster motion reveals a decrease in actin cluster speed during constriction. Myosin clusters rotate with a constant speed with decreasing speed towards the constriction completion. Error bars indicate s.d. Each point contains 4–50 measurements, 202 in total for actin and 77 for myosin. (j) Comparison of the cluster speed in different conditions and for different proteins. Rings with diameters of >1.5 μm were used. Each mean value contains 13–185 measurements. Error bars indicate s.d. One-way analysis of variance was performed, *P<0.05, **P<0.01.

