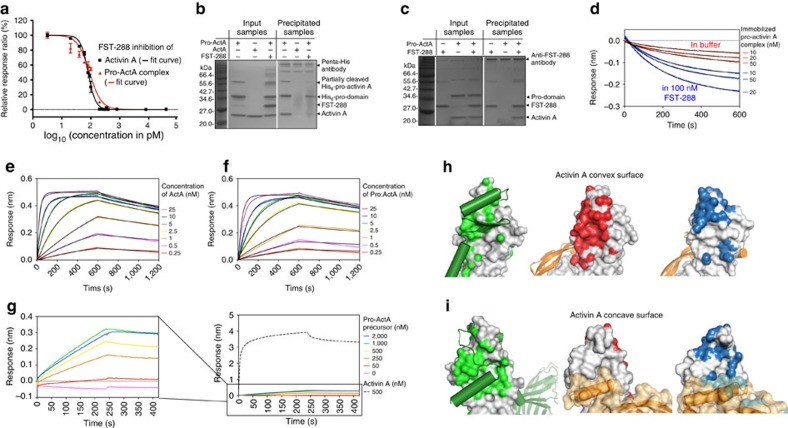
Figure 4. Activin–follistatin interaction.
(a) Inhibition of activin A signalling in luciferase-based bioassay using increasing concentrations of FST-288 with IC50 curve for each assay as solid line. Data for mature activin A are shown in black and data for pro-activin A complex in red. Data is the average of three replicates, normalized to Renilla luciferase and scaled to 100% of maximum signal. The error bars show the s.d. of each data point. (b) Non-reducing SDS–PAGE analysis of immunoprecipitation of FST-288 using anti-penta-His antibody binding to His6-tagged pro-activin A with samples before precipitation on the left and precipitated samples on the right (c) Non-reducing SDS–PAGE analysis of immunoprecipitation of activin A using anti-FST antibody binding to FST-288 with samples before precipitation on the left side and precipitated samples on the right. (d) Dissociation of mature activin A from pro-mature complex in the presence (blue points) and absence (red points) of FST-288 in the dissociation buffer, with fitted dissociation curves as black lines. (e) BLI analysis of immobilized FST-288 binding to mature activin A. Coloured curves show the raw sensogram data with fitted data as black lines. (f) BLI analysis of immobilized FST-288 binding to cleaved pro-activin A complex. Colouring as in e. (g) Sensograms for immobilized FST-288 binding to uncleaved pro-activin A precursor, with pro-activin A precursor concentrations indicated on the far right. The graph on the left shows a zoomed-in view of the data in the right panel in which the binding data for 500 nM mature activin A is shown as a black dashed line for reference. (h,i) Interactions of mature activin A on the convex type II receptor-binding surface (h) and the concave putative type I receptor-binding surface (i). Left panels show the pro-domain in the pro-mature precursor (green cartoon) binding to mature activin A (shown as surface) with the interaction surface coloured green. The middle panels shows the type II receptor-interacting surface in red (PDB:1S4Y) and the rightmost panels show interactions with follistatin in blue (PDB: 2B0U). The second protomer of mature activin A is shown as orange cartoon.

