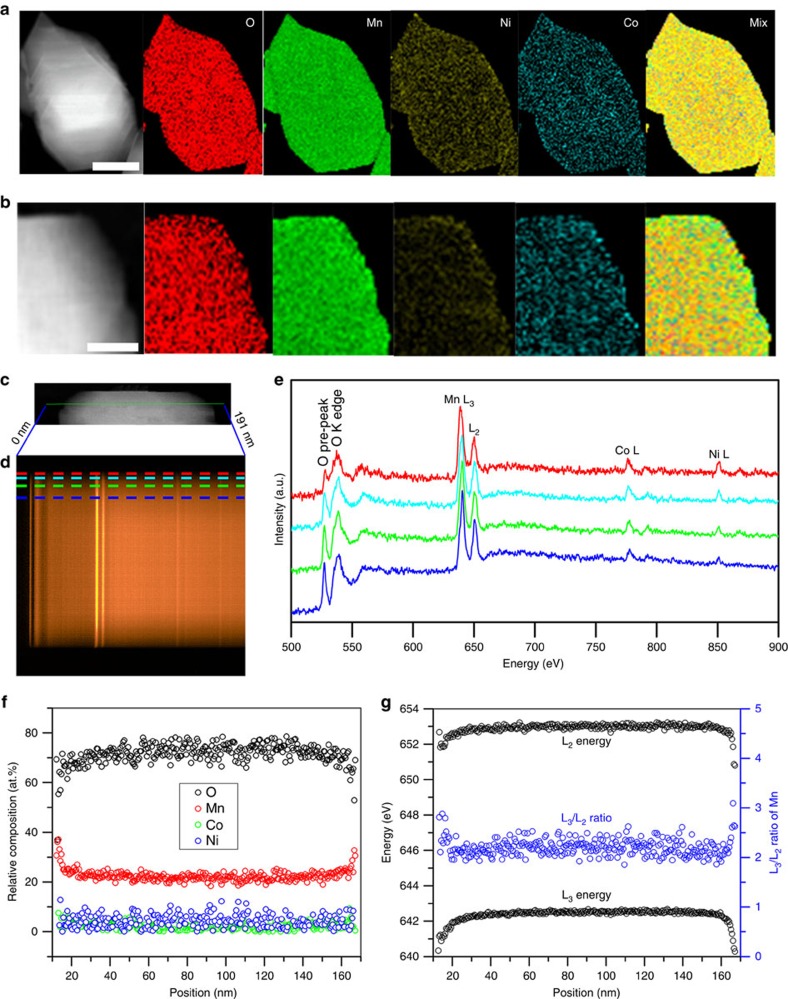
Figure 3. Relative surface composition changes for the pristine and GSIR LR-NCM.
(a) STEM-EELS spectrum images for the pristine LR-NCM. Scale bar, 50 nm. (b) The GSIR LR-NCM. Scale bar, 25 nm. Oxygen reduction at mixed colour images is well-demonstrated on the edge in comparison with the pristine LR-NCM (a). (c) STEM image of a particle of the GSIR LR-NCM. (d) EELS spectrum image from the vertical green line (0–191 nm) in the left STEM image (c), showing O K, Mn L2, 3, Co L2, 3, Ni L2, 3 edges. The dispersion is 0.25 eV/channel. The scan step is 0.127 nm. (e) EELS spectrum profiles from the surface to the interior as marked by the horizontal dashed lines with the same colour as in d. The spectra are normalized with Mn L3 peak, and each spectrum was averaged vertically with 10 individual spectra to improve the signal noise ratio. Weak O pre-peak on the surface indicates the oxygen vacancies are formed. (f) Relative atomic composition of O (black), Mn (red), Co (blue) and Ni (green) as a function of position calculated based on the integrated EELS peak intensity in e. (g) Mn L3, and L2 energy (top and bottom of panel) from refinement, and L3/L2 intensity ratio.

