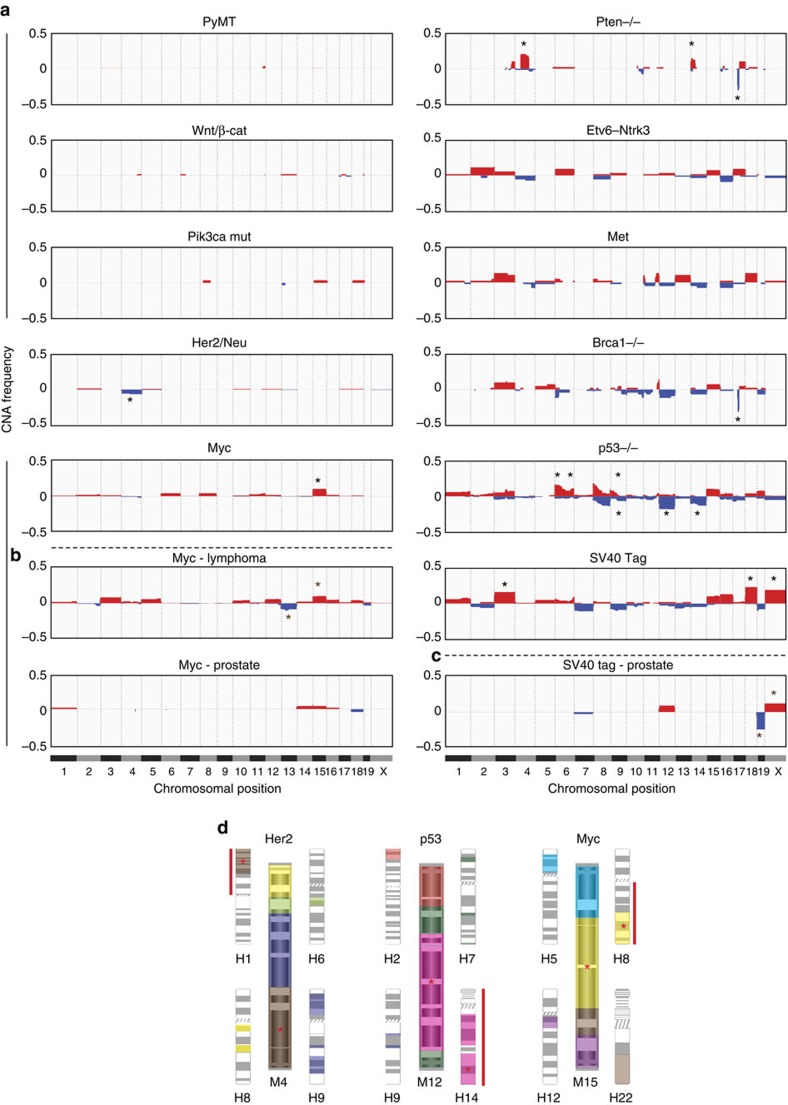
Figure 4. The landscapes of aneuploidy and large CNAs in breast cancer GEMMs reveal driver-specific recurrent events.
(a) Frequency plots of chromosomal aberrations in each of the 11 GEMMs analysed, showing that each GEMM has a characteristic landscape of aneuploidy and large CNAs. Gains are shown in red, losses in blue. The 15 statistically significant driver-specific CNAs (adjusted P<0.05; χ2-test) are highlighted with black asterisks. (b) Frequency plots of chromosomal aberrations in lymphomas and in prostate tumours induced by Myc activation, showing that trisomy 15 recurs in Myc-induced tumours in various tissues, whereas other events (for example, monosomy 13 in lymphomas) are tissue dependent. Significant CNAs (adjusted P<0.05; χ2-test) are highlighted with brown asterisks. (c) Frequency plots of chromosomal aberrations in prostate tumours induced by SV40Tag, showing that trisomy X, and potentially monosomies 7 and 19, recur in SV40Tag-induced tumours independent of the tissue type, whereas other events (for example, trisomies 3 and 18 in breast tumours) are tissue dependent. Significant CNAs (adjusted P<0.05; χ2-test) are highlighted with brown asterisks. (d) Comparative oncogenomics can narrow regions of interest within recurrent CNAs in both species. Presented is a synteny analysis of three driver-specific CNAs: mouse chromosomes are shown in the centre, and syntenic human chromosomes surround them. Synteny blocks (>300 kb; small gaps filled) are color coded. Significantly, enriched CNAs in human tumours that activate the same pathway (as judged by gene expression signatures33) are marked with a red line to the side of the human chromosome. The synteny blocks that correspond to recurrent events in both species are marked with red asterisks. For example, trisomy 15 recurs in Myc-induced mouse breast cancer; as 8q amplification recurs in human tumours with high MYC expression signature, but only a telomere-bound part of 8q is syntenic to mouse chromosome 15, the region of interest within human chromosome 8q can be thus considerably narrowed (∼50% reduction in size). Of note, MYC itself is located within this syntenic region. See also Supplementary Figs 7–9.

