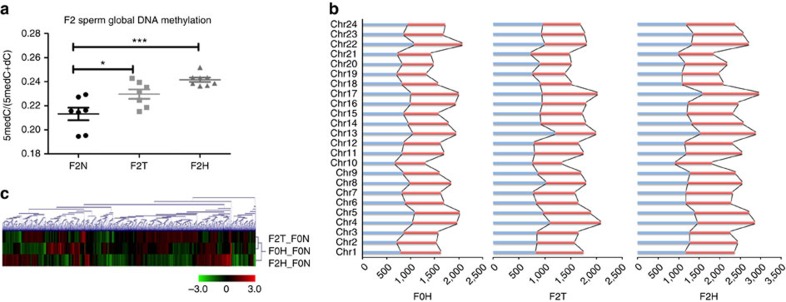
Figure 4. Transgenerational effect of hypoxia on the epigenome.
(a) The ratio of 5-methylcytosine to the total cytosine pool was measured in the F2N, F2T and F2H groups using liquid chromatography-tandem mass spectrometry (LC-MS/MS; n=7–8). (b) Clustering of differentially methylated regions (DMRs) in the F0H, F2T and F2H groups compared to the F0N groups. Hypermethylated and hypomethylated regions are represented by red and green colour, respectively (n=10). (c) Chromosomal distribution of DMRs normalized to the F0N group. Red and blue bars indicate the numbers of hypermethylated regions and hypomethylated regions, respectively. Data are presented as the means±s.e.m. (*P<0.05, ***P<0.001; n=10).

