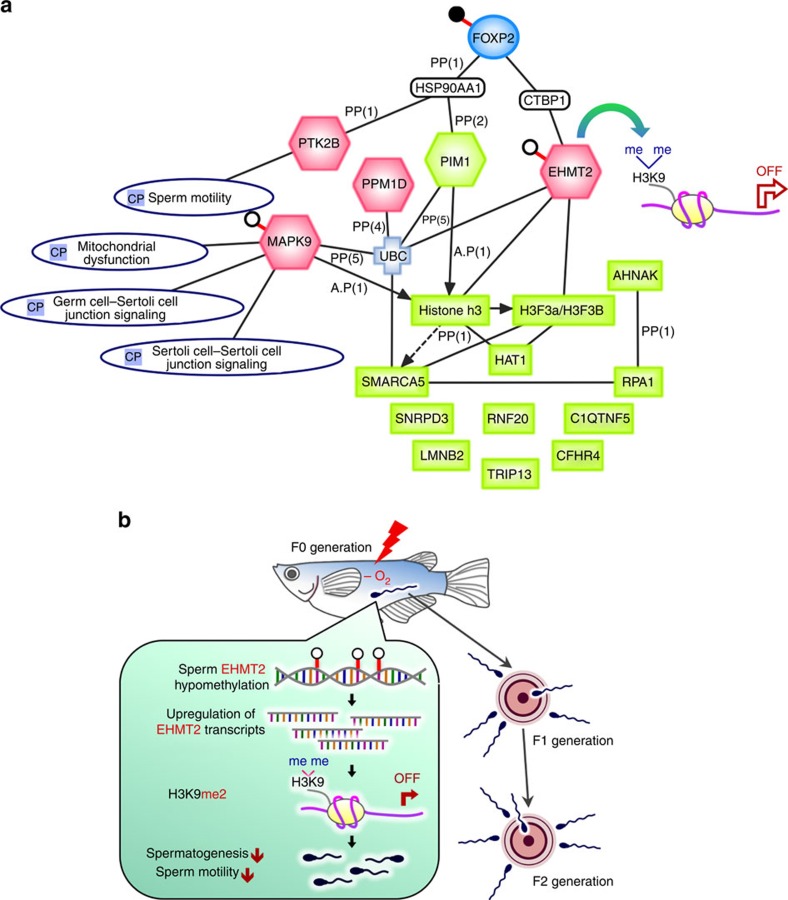
Figure 5. Integrated omics analysis.
(a) IPA integrates the transgenerational effects at the epigenomic, transcriptomic and proteomic levels, which are represented by oval, hexagonal and rectangular symbols, respectively. Black and white dots indicate hypermethylation and hypomethylation, respectively. Pink and green denote changes in the expression of genes or proteins, respectively. CP, canonical pathways. (b) Schematic diagram of the current findings.

