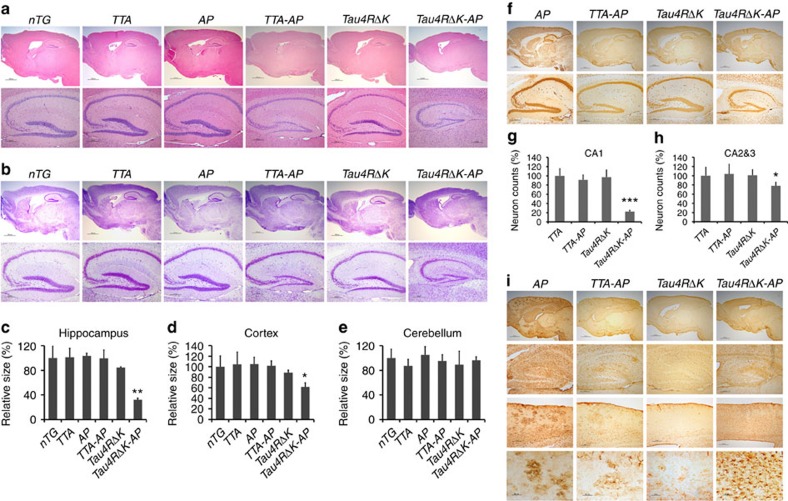
Figure 7. Acceleration of neuronal loss, astrocytosis and forebrain atrophy in Tau4RΔK-AP mice.
(a) Hematoxylin and eosin (H&E) staining of sagittal sections of brains (upper panels; scale bar, 1,000 μm) and hippocampi (lower panels; scale bar, 200 μm) of 9-month-old female TTA, APPswe;PS1ΔE9(AP), TTA;APPswe;PS1ΔE9 (TTA-AP), Tau4RΔK, Tau4RΔK;APPswe;PS1ΔE9 (Tau4RΔK-AP) and non-transgenic (nTG) mice. Note forebrain atrophy and reduction of neurons in the cortical and hippocampal area of Tau4RΔK-AP mice. (b) Cresyl violet (CV) staining of sagittal sections of brains (upper panels; scale bar, 1,000 μm) and hippocampi (lower panels; scale bar, 200 μm) of 9-month-old female TTA, APPswe;PS1ΔE9(AP), TTA;APPswe;PS1ΔE9 (TTA-AP), Tau4RΔK, Tau4RΔK;APPswe;PS1ΔE9 (Tau4RΔK-AP) and non-transgenic (nTG) mice. Note reduction of neurons in Tau4RΔK-AP mice. (c–e) Sizes of hippocampal (c), cortical (d) and cerebellum (e) regions in brains of 9 months old TTA (n=6), AP (n=7), TTA-AP (n=6), Tau4RΔK (n=5), Tau4RΔK-AP (n=4) and nTG (n=15). Note reduction of hippocampus (one-way analysis of variance (ANOVA), **P=0.00052) and cortical region (one-way ANOVA, *P=0.014), but not cerebellum in Tau4RΔK-AP mice (f) Immunohistochemical analysis of brains of 9 months old APPswe;PS1ΔE9, TTA-AP, Tau4RΔK and Tau4RΔK-AP mice using antiserum specific to NeuN to detect neurons; sagittal sections of brains (upper panels; scale bar, 1,000 μm) and hippocampi (lower panels; scale bar, 200 μm). Note forebrain atrophy and reduction of neurons in the cortical and hippocampal area of Tau4RΔK-AP mice. (g) Neuronal cell count of CA1 region from 9 months old TTA (n=5), TTA-AP (n=6), Tau4RΔK (n=5), Tau4RΔK-AP (n=5) mice using ImageJ analysis. Note ∼80% reduction of neurons in Tau4RΔK-AP mice. (***, One-way ANOVA, P=2.04E-06) (h) Neuronal cell count of CA2 and CA3 regions from 9 months old mice using ImageJ analysis. Significant reduction (∼20%) of neurons are observed of Tau4RΔK-AP mice as compared with those of control mice. (one-way ANOVA, *P=0.0133) (i) Immunohistochemial analysis of brains of APPswe;PS1ΔE99, TTA-AP, Tau4RΔK and Tau4RΔK-AP mice at 9 months of age using antiserum against GFAP: sagittal section (top panel, scale bar, 1,000 μm); hippocampi (second panel, scale bar, 200 μm); cortex (third panel, scale bar, 200 μm); higher power views of cortex (fourth panel, scale bar, 50 μm). Note hypertrophic GFAP positive astrocytes in cortex of Tau4RΔK-AP mice.

