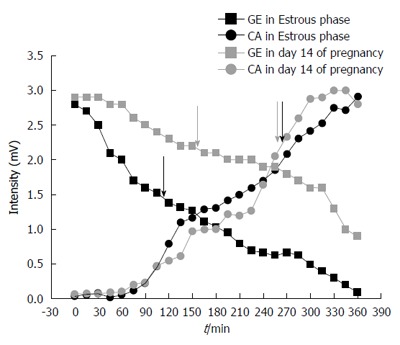
Figure 2.

Profile of gastric emptying and cecum arrival obtained in estrous cycle (estrous phase) and pregnancy (day 14). Arrows indicate the statistical moment (minutes in X-axis), and consequently, mean gastric emptying time and mean cecum arrival time for each example.
