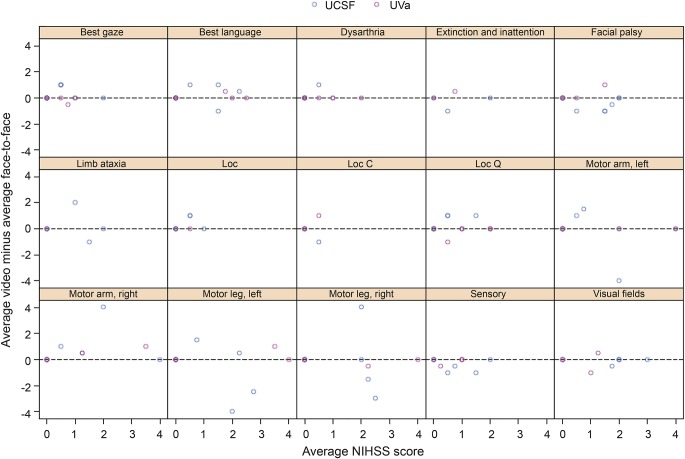
Figure 4. Bland-Altman plot for itemized NIHSS components.
The vertical axis represents the difference between video (remote) and face-to-face (bedside) NIHSS scores for individual items. The horizontal axis represents the average of the item scores for each scenario. Outlier differences for motor arm/leg left/right (4-point difference) were likely attributable to left/right confusion on the scoring sheet for one of the scenarios at the UCSF site. Loc = level of consciousness; Loc C = level of consciousness commands; Loc Q = level of consciousness questions; NIHSS = NIH Stroke Scale; UCSF = University of California, San Francisco (Bay area); UVa = University of Virginia (central Virginia).

