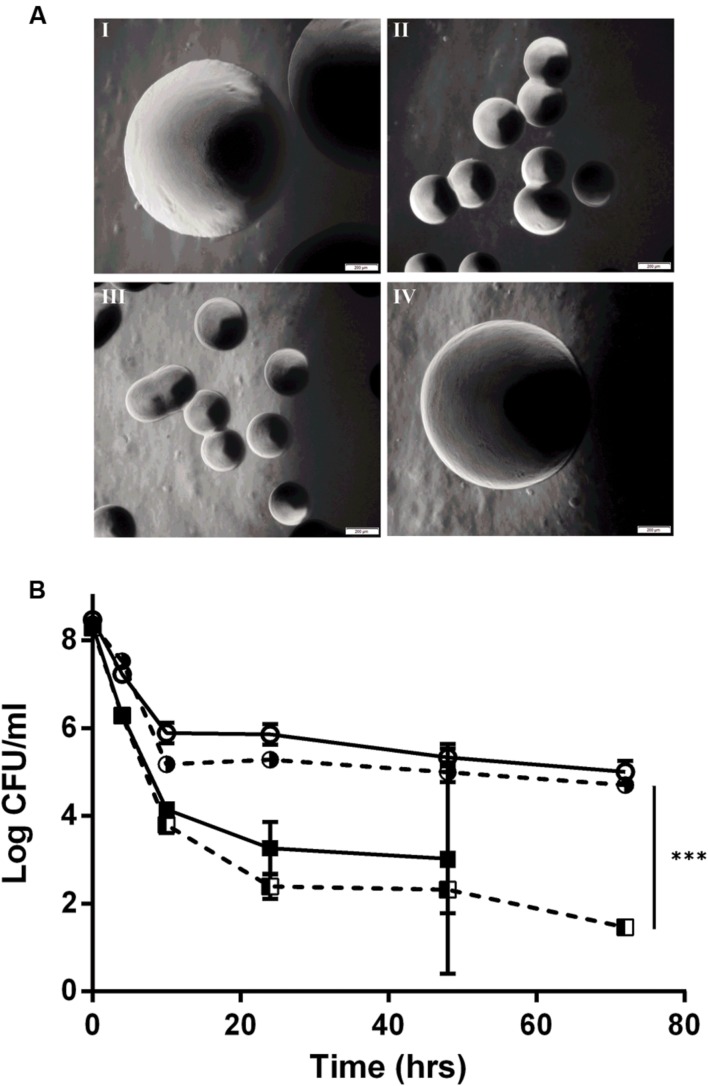
FIGURE 2.
hemA complementation experiments showing (A) colony morphology at 40x magnification of I: N53-1, II: SCV E18, III: E18 pSOG30222, and IV: E18 pSOG30222::hemA after 24 h of incubation at 37°C on BHI plates and (B) Killing of L. monocytogenes N53-1 ( ) and SCV E18 (
 ) strains, as well as the hemA complemented (
 ) and empty vector control E18 (
 ) strains exposed to 100 μg/ml norfloxacin for 72 h. The data represents three biological replicates with standard deviation of the mean. Significance was determined using a paired t-test (∗∗∗p < 0.000005).

