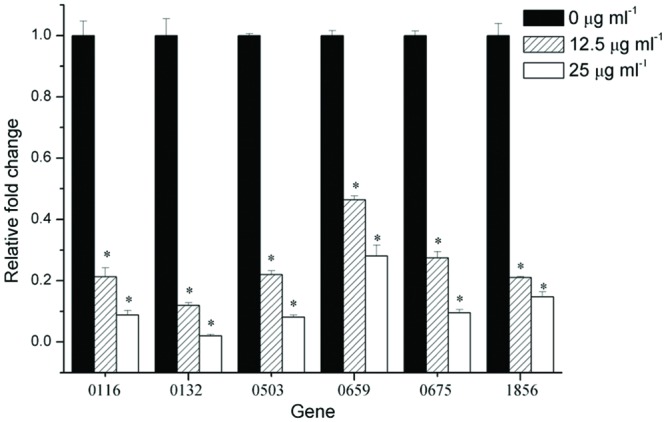
FIGURE 5.

Gene expression of F. nucleatum strain biofilms. The results represent the means and SDs of at least three independent experiments performed in triplicate. Statistically significant differences (∗P < 0.05) in gene expression between different concentrations.
