Figure 2.
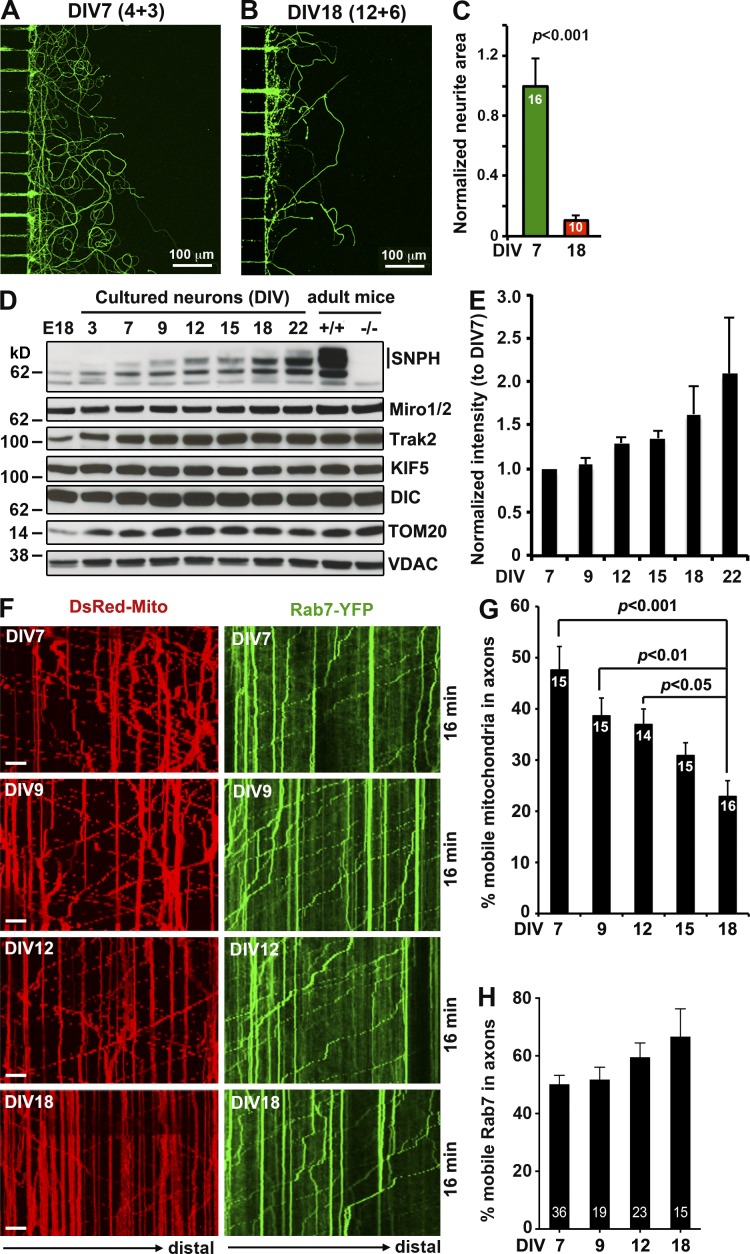
SNPH-mediated mitochondrial anchoring contributes to reduced regrowth capacity in mature neurons. (A–C) Representative microfluidic images (A and B) and quantitative analysis (C) showing reduced capacity of axonal regrowth in mature cortical neurons after axotomy. Neurons were axotomized at DIV4 (A) or DIV12 (B) and imaged by staining of βIII-tubulin 3 (A) or 6 d (B) after injury. Although young neurons at DIV7 maintain some level of regrowth capacity, mature neurons at DIV18 show failed regeneration (P < 0.001, Mann–Whitney test). (D and E) Representative immunoblots (D) and quantitative analysis (E) showing progressive increase in SNPH expression with neuron maturation. Cortical neurons isolated from E18 mouse brains were cultured for 3, 7, 9, 12, 15, 18, and 22 d. Equal amounts (20 µg) of cell lysates were loaded and sequentially immunoblotted with various antibodies after stripping between applications of each antibody. Brain lysates from E18 WT, adult WT, and adult snph KO mice were used as controls. The intensity of SNPH bands were quantified from three repeats, calibrated with TOM20 levels, and then normalized to SNPH expression at DIV7. (F–H) Kymographs (F) and quantitative analysis (G and H) showing progressive decline of axonal mitochondrial motility with neuron maturation. Cortical neurons were transfected with DsRed-Mito or Rab7-YFP. Time-lapse images, obtained at DIV7, 9, 12, or 18, were recorded for 100 frames with 5-s intervals. In kymographs, vertical lines represent stationary organelles; oblique lines or curves to the right indicate anterograde transport toward distal terminals. Note that axonal mitochondria have progressively reduced motility, whereas late endosomes show no significant change in their motility in the same axons during maturation. Bars, 10 µm. Data were analyzed from the total number of chambers indicated within bars (C) or the total number of neurons indicated within bars (G and H) and expressed as mean ± SE and by one-way ANOVA test.

