Figure 6.
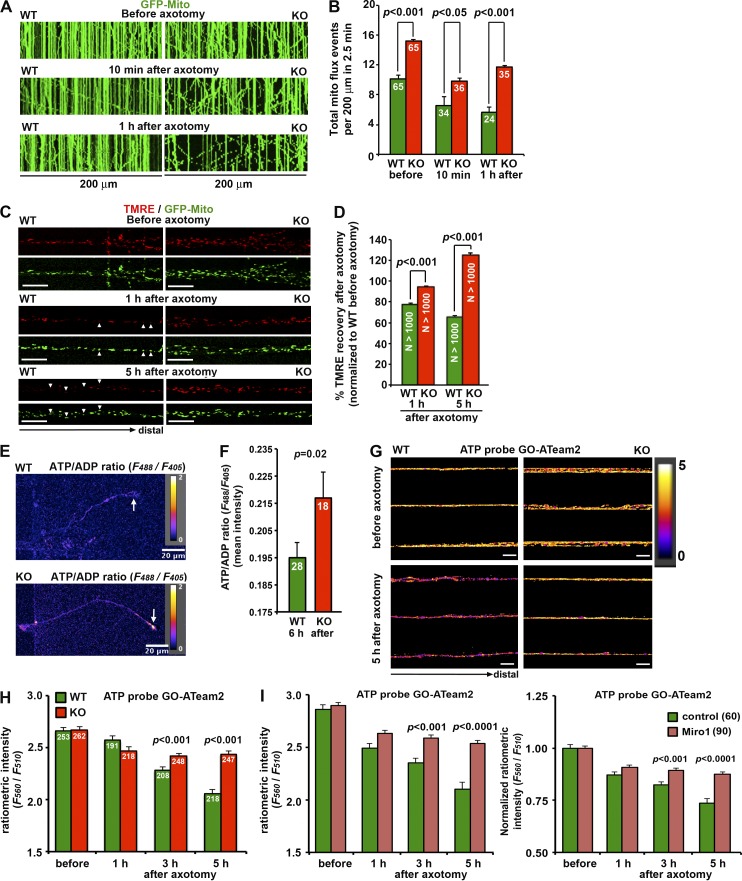
Enhanced mitochondrial transport recovers mitochondrial integrity and rescues energy deficits in injured axons. (A and B) Kymographs (A) and quantitative analysis (B) showing axonal mitochondrial flux of WT and snph KO cortical neurons along microgrooves. Neurons were infected with pLenti-GFP-Mito. Time-lapse imaging was recorded for 30 frames with a 5-s interval for a total of 2.5 min. In kymographs, vertical lines represent stationary organelles; oblique lines or curves to the right indicate anterograde transport toward terminals. The mitochondrial flux in axonal bundles was measured by the total events of bidirectional transport through microgrooves. The images were acquired by 40× lens. Note that deleting snph significantly increases axonal mitochondrial flux before and after axotomy when compared with WT neurons. Data were analyzed from the total number of microgrooves indicated within bars from more than three independent experiments and expressed as mean ± SE and by Student’s t test. (C and D) Images (C) and quantitative analysis (D) showing the recovery of TMRE staining on axonal mitochondria in the microgrooves adjacent to the axotomized site. Cortical neurons were infected with pLenti-GFP-Mito, and axon bundles were loaded with 20 nM TMRE dye before or 1 or 5 h after axotomy. Live images were acquired at 12 bit below the saturate setting for quantitative analysis of Δψm of individual GFP-Mito–labeled mitochondria in axon bundles. Note that axotomy impairs mitochondrial integrity by depolarizing Δψm (reduced TMRE staining, arrowheads) in the distal axons of WT neurons; the phenotype can be effectively reversed by enhanced mitochondrial transport in snph KO axons. Data were analyzed from the total number of mitochondria (n > 1,000) for each condition indicated within bars. (E and F) Pseudo-color images (E) and quantitative analysis (F) showing ATP maintenance in the growing tips 6 h after axotomy in WT and snph KO neurons infected with pLenti-PercevalHR. The F488nm/F405nm ratiometric mean intensity of PercevalHR reflects the relative ATP/ADP ratio. Note that enhanced mitochondrial transport in snph KO axons increases the ATP/ADP ratio in the growing tips (white arrows). (G and H) Pseudo-color ratiometric images (G) and the F560nm/F510nm ratiometric integrated intensity (H) of ATP probe GO-ATeam2. Both WT and snph KO cortical neurons were transfected with ATP-sensitive GO-ATeam2 probe, followed by imaging distal 150-µm microgrooves before or 1, 3, or 5 h after axotomy. Note that WT neurons display reduced F560nm/F510nm integrated intensity after axotomy, suggesting ATP depletion. Enhancing mitochondrial transport in snph KO neurons reverses energy deficits. (I) Overexpressing Miro1 rescues axotomy-induced energy deficits. Quantitative analysis shows the F560nm/F510nm ratiometric integrated intensity (left) and normalized F560nm/F510nm integrated intensity (right) of ATP probe GO-ATeam2. WT neurons were coinfected with lenti–GO-ATeam2 and lenti-control vector or lenti-Miro1 at DIV0, followed by axotomy at DIV8 and imaging of distal 150-µm microgrooves before or 1, 3, or 5 h after axotomy. Note that enhancing mitochondrial transport in WT neurons expressing Miro1 recovers energy deficits. Data were analyzed from the total number of microgrooves indicated within bars or in parentheses and expressed as mean ± SE and Mann–Whitney U test (F) or Student’s t test (D, H, and I). Bars, 20 µm.

