Figure 7.
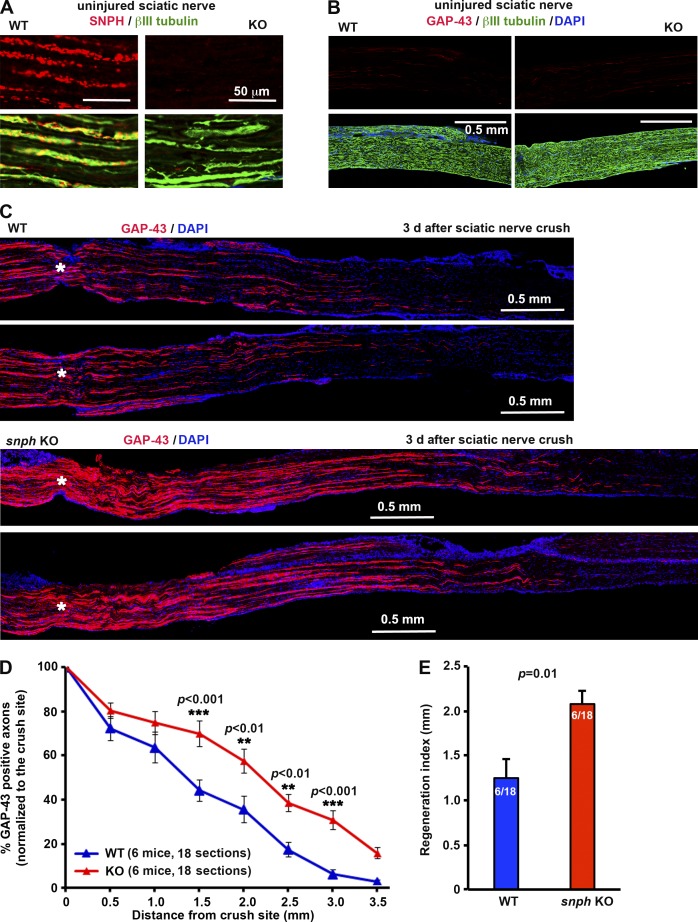
SNPH KO sciatic nerves display enhanced regenerative capacity after crush injury. Adult WT and snph KO mice (2 mo old) were subjected to a sciatic nerve crush injury and sacrificed at 3 d after injury. Regenerating axons through and beyond the lesion site were visualized by their expression of GAP-43 on sciatic nerve longitudinal sections. DAPI was used to label the cell nuclei. Sciatic nerves from the contralateral side were used as uninjured controls. (A) Although SNPH-labeled mitochondria are abundant along the axons (labeled by βIII-tubulin) of the uninjured WT sciatic nerve, SNPH staining was absent in the same region of snph KO mice. (B) Expression of GAP-43 was undetectable in the uninjured sciatic nerve axons of WT and snph KO mice. (C) Representative images of sciatic nerve longitudinal sections show GAP-43–positive regenerating axons. Note that at 3 d after the crush injury, snph KO mice display a marked increase in the number and growth distance of GAP-43–positive axons past the injury site as compared with the WT littermates. The crush site is indicated by asterisks. (D) Quantification of GAP-43–positive axons in the distal sciatic nerves reveals that regenerating axons grew significantly longer distances at 3 d after injury in snph KO mice than WT controls. The number of GAP-43–positive axons at various distances from the crush site was counted and normalized to the crush site. Note that snph KO mice display significantly more regenerating axons at 1.5 (***, P < 0.001), 2.0 (**, P < 0.01), 2.5 (**, P < 0.01), and 3.0 mm (***, P < 0.001) distal to the crush site (two-way ANOVA, followed by Bonferroni’s post-hoc test). (E) The regeneration index was measured as the distance away from the crush site in which the mean number of regenerating axons is half of that observed at the crush site. snph KO sciatic nerves show a higher regeneration index compared with WT (P = 0.01, Student’s t test). Data are mean ± SE (n = 6 mice per genotype and 3 longitudinal sections per animal).

