Figure 3.

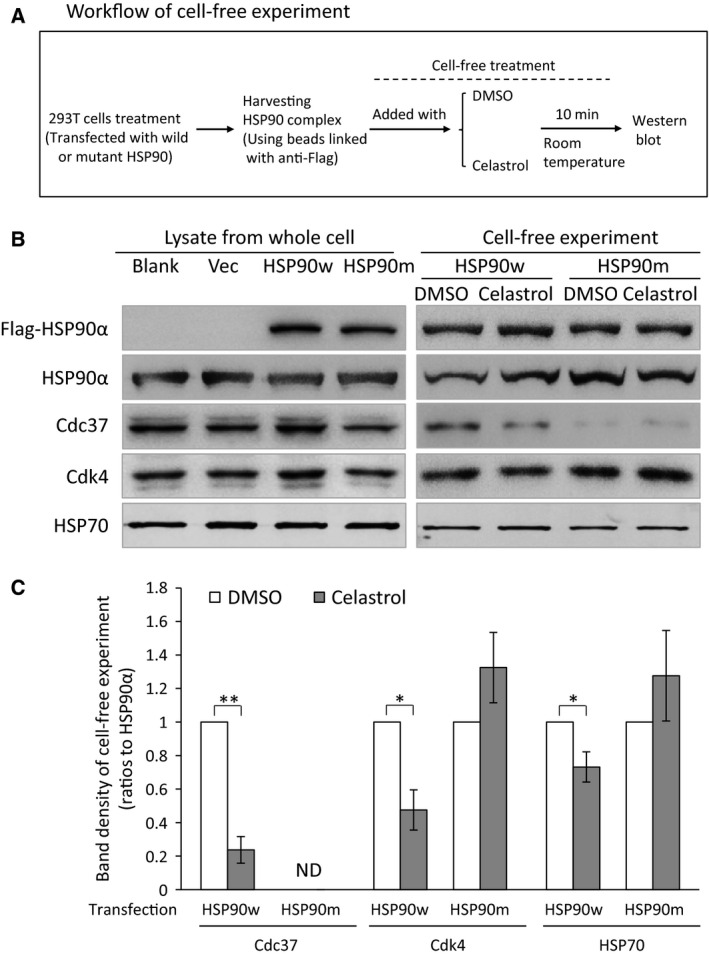
Effects of celastrol on wild‐type or mutant HSP90 complex in cell‐free system. (A) The flowchart for cell‐free experiment. The cells transfected with wild or mutant HSP90 were lysed and the whole proteins were extracted. Wild or mutant HSP90 complexes were captured by incubation of protein extracts with Protein A/G plus agarose and anti‐Flag antibody. The beads with HSP90 complex were incubated with celastrol or DMSO for 10 min before being heated to collect proteins. The proteins were subjected to western blot. (B) Western blot of the related proteins. The left panels show proteins from whole cells, while the right panels show proteins harvested from beads after cell‐free treatment. (C) The histogram and statistical results of band densities from western blot of proteins in beads after cell‐free treatments (as shown in the right panel of B). Band densities of Cdc37, Cdk4, and HSP70 were adjusted using that of HSP90α bands, and the calibrated value of each protein from the DMSO group was set as 1.0. Blank: cells without transfection. Vec: cells transfected with vector. HSP90w: cells transfected with HSP90–wild plasmid. HSP90m: cells transfected with HSP90–mutant plasmid. ND: densities were not detectable by scanning. The data are presented as mean ± standard deviation, n = 3. *P < 0.05; **P < 0.01.
