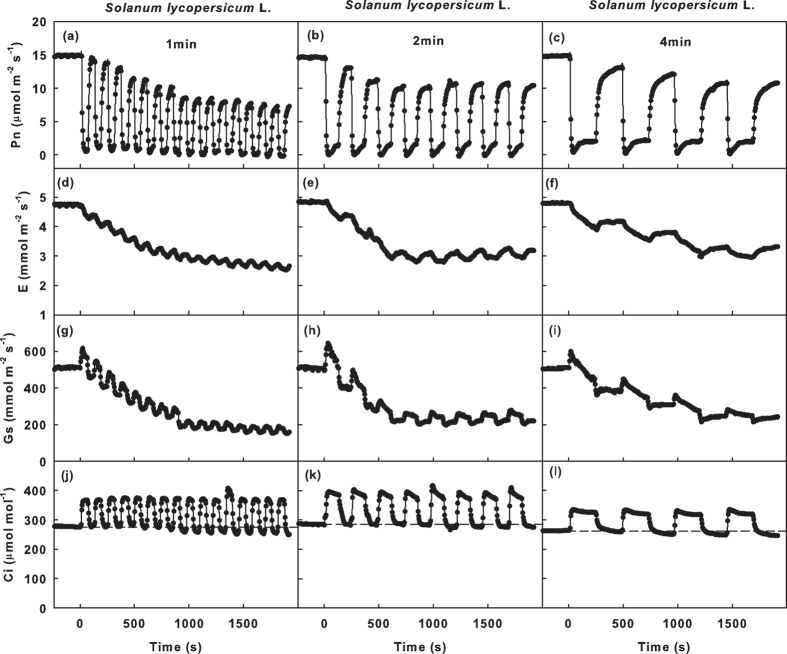
Figure 5. Time course for Pn, E, Gs, Ci in Solanum lycopersicum L. leaves under simulated ad-ab-alt irradiation.
Time course for the net photosynthetic rates (Pn; a–c), transpiration rate (E; d–f), stomatal conductance (Gs; g–i) and intercelluar CO2 pressure (Ci; j–i) in Solanum lycopersicum L. leaves when the adaxial or abaxial surfaces of leaves were irradiated by fluctuating light, in which the irradiation was switched between high light (1,000 μmol m−2 s−1) and low light (100 μmol m−2 s−1) every 1 min (a,d,g,j) or 2 min (b,e,h,k) or 4 min (c,f,i,l). The dotted line shows the Ci under ad-con irradiation.

