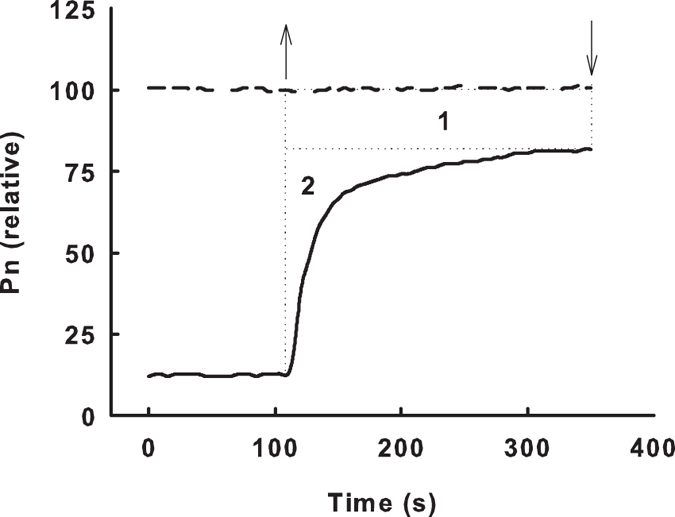
Figure 7. Sketch map of the time course of the net photosynthetic rates (Pn) in response to fluctuating light.

The upward arrow shows the leaves were transferred from low light to high light, and the downward arrow shows the leaves were transferred from high light to low light.
