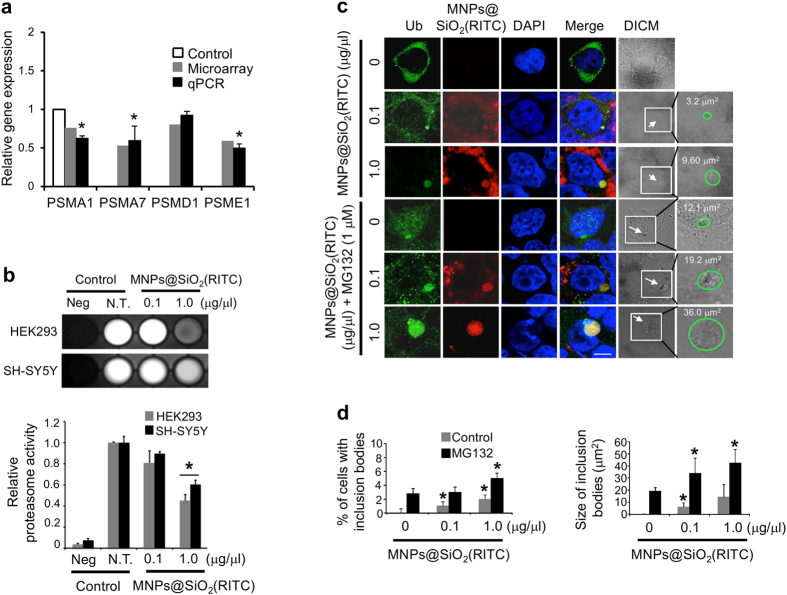
Figure 2. Proteasome activity and formation of inclusion bodies in HEK293 cells treated with MNPs@SiO2(RITC).
(a) Quantitative analysis of ubiquitin proteasome pathway-related genes using quantitative real-time PCR. HEK293 cells were treated with 1.0 μg/μl of MNPs@SiO2(RITC) for 12 h. qPCR was performed using specific primers for target genes PSMA1, PSMA7, PSMD1, and PSME1. Gene expression levels of the target genes were normalized relative to the corresponding means in non-treated controls and compared with the microarray signal intensity of respective genes. GAPDH was used as internal control in qPCR. (b) Inhibition of proteasome activity in HEK293 and SH-SY5Y cells treated with MNPs@SiO2(RITC). A luminescence-based assay was performed on untreated (N.T.), 0.1 μg/μl, and 1.0 μg/μl MNPs@SiO2(RITC)-treated cells. The intensities were quantified with MultiGauge 3.0 software. (c) Characterization of ubiquitin-positive inclusion bodies in Synph-293 cells treated with MNPs@SiO2(RITC). Cells were treated with 0.1 μg/μl or 1.0 μg/μl of MNPs@SiO2(RITC) for 48 h followed by immunocytochemistry. The proteasome inhibitor MG132 (1.0 μM) was added to the cells at 36 h. Cells showed formation of cytoplasmic inclusions (arrow). Green, ubiquitin; red, MNPs@SiO2(RITC); blue, DAPI. Scale bar = 5 μm. (d) Quantification of percentage and size of ubiquitin-MNPs@SiO2(RITC)-positive inclusion bodies in Synph-293 cells treated with MNPs@SiO2(RITC). In total, 300 cells per experimental group were counted in 3 independent sets of experiments, and data represent mean values ± S.D. of triplicate measurements relative to control. *p value < 0.05 in one-way ANOVA compared to control.

