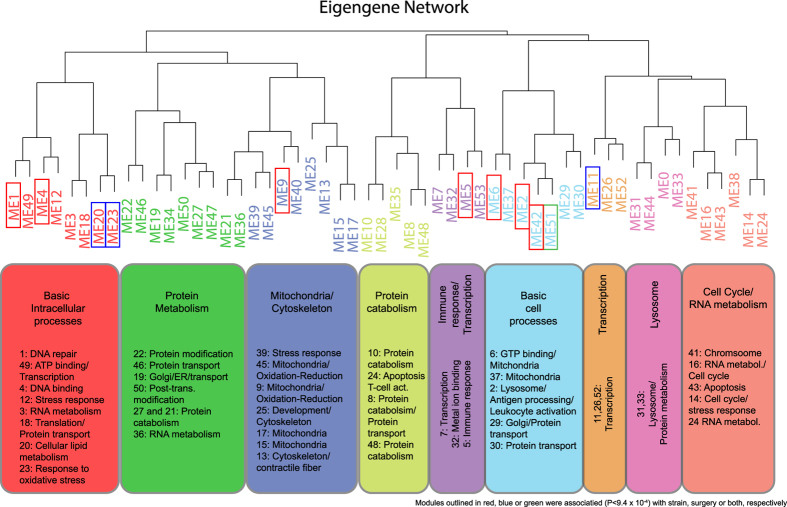
Figure 1. Organization of the bone co-expression network based on module eigengenes.
An eigengene network was constructed by hierarchical clustering of the eigengenes for all 53 modules in the bone network. Modules are colored coded based on a general similarity in gene ontology enrichments. Modules outlined in red, blue or green were associated (P < 9.4 × 10⁻³) with strain, surgery or both, respectively.

