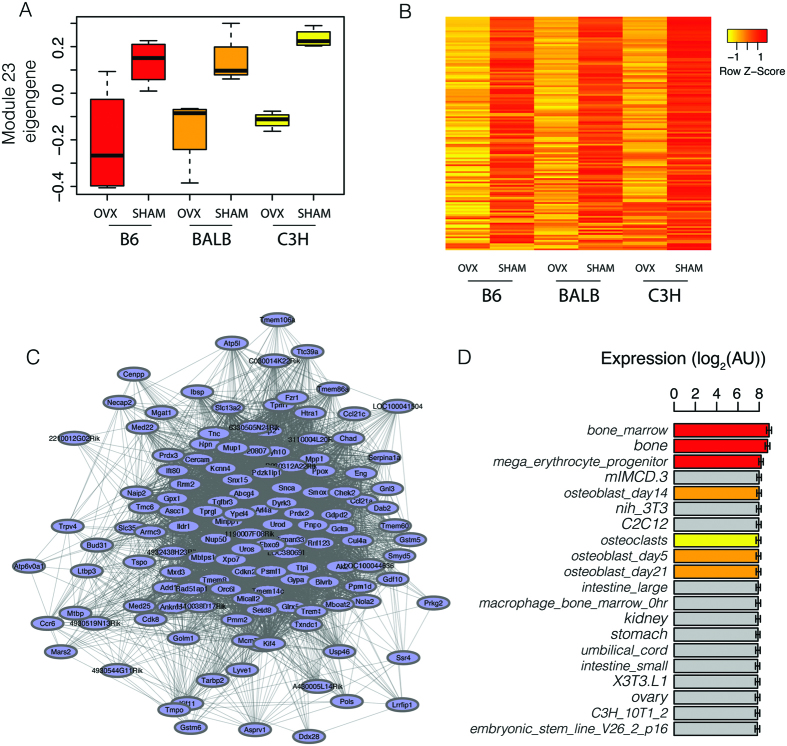
Figure 2. Identification and characterization of module 23.
(A) Module 23 gene expression levels are decreased by OVX across three inbred strains (N = 4 biological replicates per strain and surgical group). (B) Heatmap demonstrating the strong co-expression of module 23 genes. (C) The module 23 network where lines connecting genes represent co-expression relationships in the top 50% of all topological overlap measures (TOMs). (D) Module 23 genes are highly expressed in bone marrow and bone as compared to 96 other mouse tissue and cell types (the 20 samples with the highest mean module 23 expression are shown). Values in (D) are means ± s.e.m. B6 = C57BL6/J, BALB = BALB/cJ, C3H = C3H/HeJ, OVX = ovariectomized, SHAM = sham operated and AU = arbitrary units.

