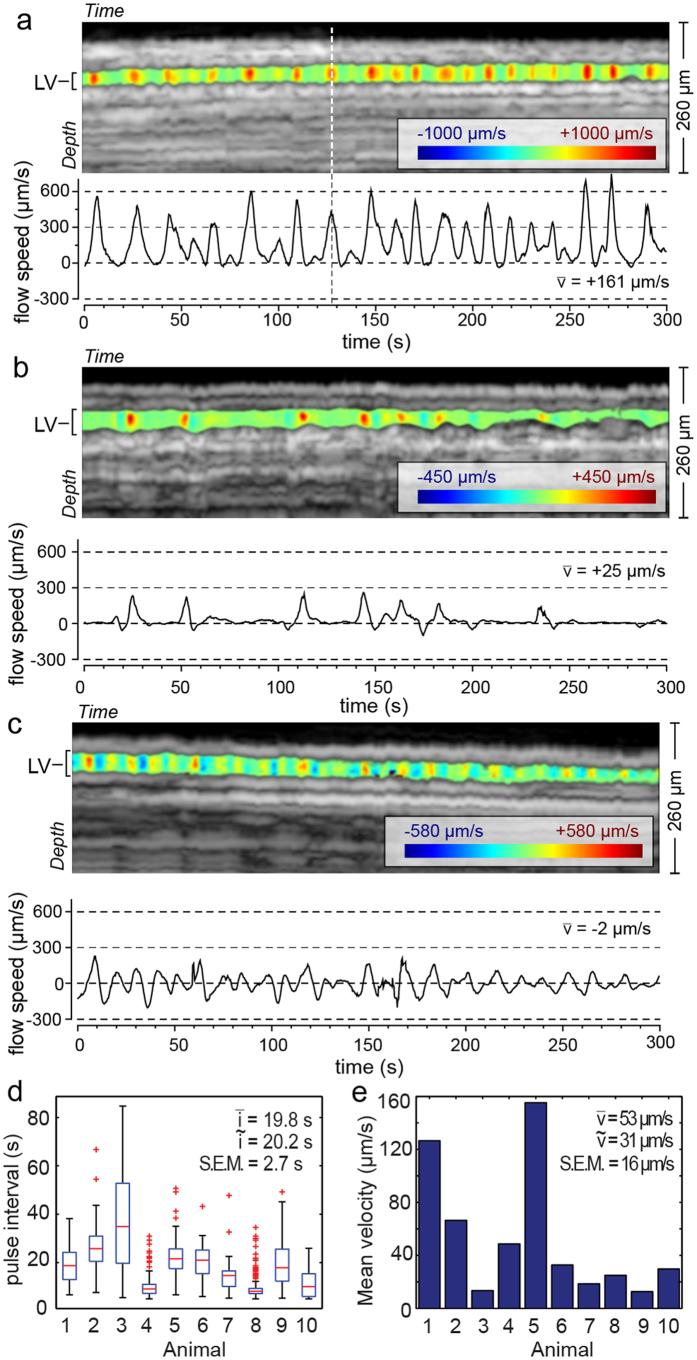
Figure 3. M-Mode DOCT measurement of pulsatile lymph flow velocity.
(a) Depth and time-resolved flow velocity in the lymphatic vessel lumen overlaid on the M-Mode intensity image. The measurement location is highlighted in Fig. 1(a). The positive velocity indicates flow proximally toward the body. The animal leg was lying lower than the abdomen. The flow direction was therefore against gravity. A velocity time trace was calculated by averaging the flow velocity in the vessel over the lymphatic vessel (LV) depth. The maximum amplitude of this velocity is smaller than in the image above because of this depth averaging. (b) An M-Mode measurement showing periods of backflow. (c) A measurement in another animal showing an oscillatory flow velocity at relatively higher frequency than pulsatile flow exemplified by panel (a). (d) The average pulse interval for 10 animals showing pronounced pulsatile flow dynamics. The box plot for each animal includes data obtained over multiple five minute duration measurements. The mean pulse interval is 19.8 seconds and is much longer than respiratory or cardiac cycles. (e) The mean flow velocity in the same animals as in (d) calculated as the average over individual five minute measurements.  and S.E.M. denote mean, median and standard error of the mean respectively.

