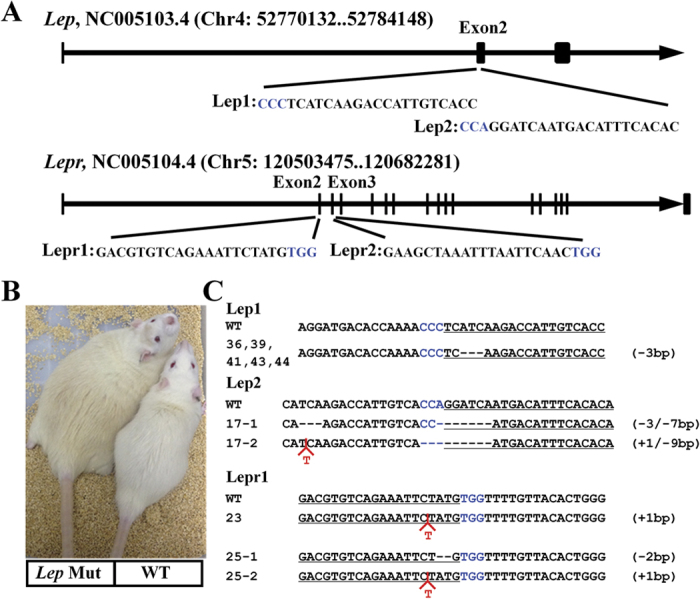
Figure 1. Generation of Lep and Lepr mutant rats with the CRISPR/Cas9 system.

(A) DNA sequences of the targeting sites at Lep and Lepr loci. The sgRNA targeting sequence is shown in black, and the PAM sequence is shown in blue. (B) A male Lep Mutant rat (# 11) showed obese phenotype at age of wk-12 compared to a male WT rat. (C) Representative sequencing results of the mutant alleles in the founders. The gRNA-targeting sequences are underlined and the PAM is highlighted in blue. The deletions are indicated as – whereas the insertions are in red. The number of insertions (+) or deletions (−) are shown to the right of each allele.
