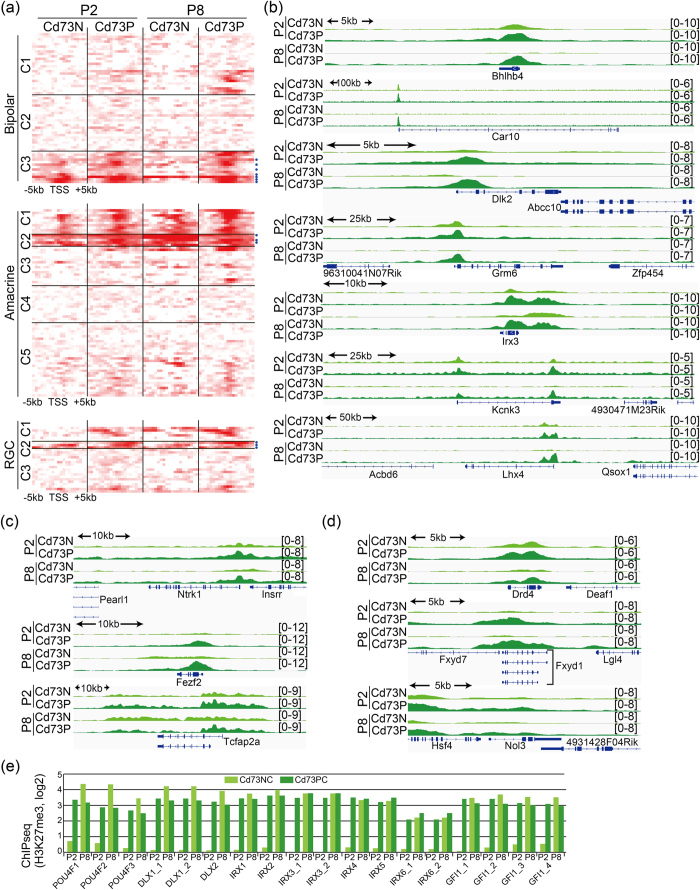
Figure 5. Genome browser tracks of H3K27me3 signals in gene loci of bipolar, amacrine, RGC.
(a) Heat map of H3K27me3 occupancy for 10 kb region around TSS. Each row indicates H3K27me3-modified DNA fragment. Colors indicate enrichment for H3K27me3. Order of genes is the same order with that in Supplemental Fig. 4. (e–g) Genome browser snapshots showing the indicated region of log2 ratio enrichment for H3K27me3. Genes in C3 subclass of bipolar (b), C2 subclass of amacrine (c), and C2 subclass of RGC (d) are shown.

