
Figure 7. Contourplot of the optimal probability 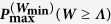 of Eq. (44) for
  and −ΔF = 1, as a function of μ and Λ.
By definition μ can not exceed −ΔF and the problem for Λ ≤ −ΔF becomes trivial, so we excluded those regions from the plot.