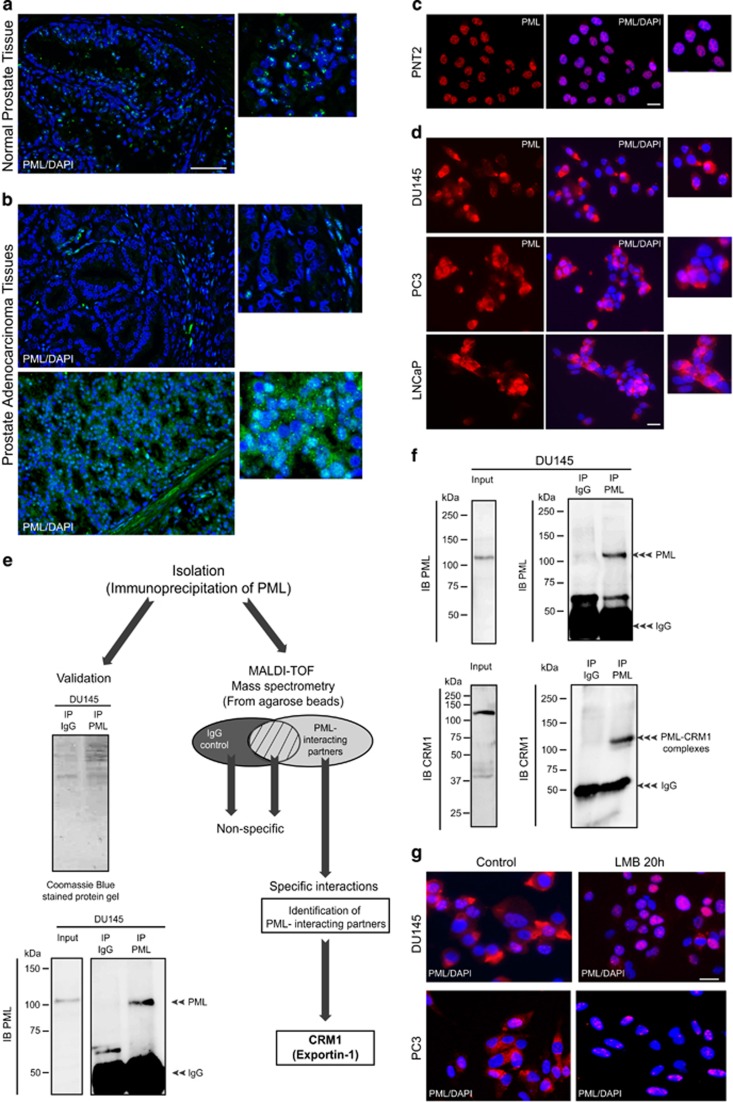
Figure 1.
PML expression in normal and cancer prostate cells. (a and b) Immunohistochemistry/fluorescence micrographs showing PML expression (green) in normal prostate tissue and prostate adenocarcinoma. The nucleus is stained in blue (4,6-diamidino-2-phenylindole (DAPI)). Scale bar=100 μm. (c and d) Immunofluorescence micrograph showing PML expression (red) in normal prostate cell line (PNT2) and in prostate cancer cell lines (DU145, PC3 and LNCaP). Scale bar=20 μm. (e) Schematic representation of the methodology used to identify PML-interacting partners from DU145 cell extracts using immunoprecipitation (IP) with PML antibody and MALDI-TOF mass spectrometry. (f) Immunoprecipition of DU145 cell extract with PML antibody and immunoblotting (IB) with PML and CRM1 antibodies. (g) Immunofluorescence micrograph showing PML expression in DU145 and PC3 treated with or without Leptomycin B (15 ng/ml). Scale bar=20 μm.

