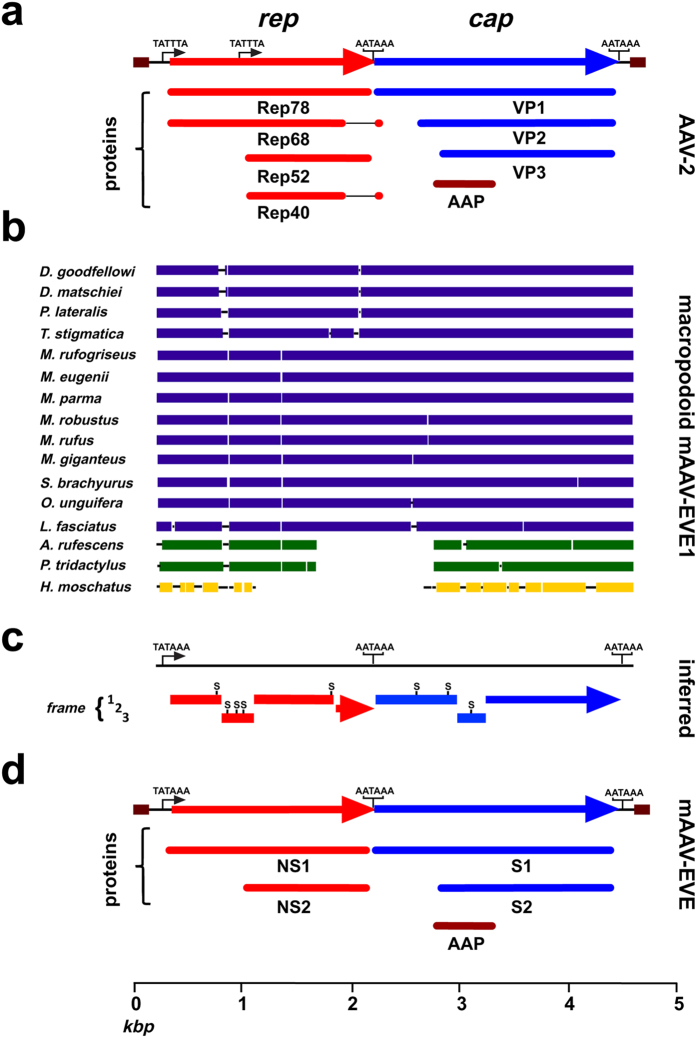
Figure 3. Maximum likelihood estimation of an inferred mAAV-EVE ancestral sequence.
(a) Schematic representation of the genes and protein products encoded by the prototypical AAV serotype, AAV2. Relative positions of the P5 and P19 promoters (“TATA” boxes) and AATAAA polyadenylation signals are indicated. The central polyadenylation signal of AAV2 might not be utilised. (b) Schematic representation of the genetic structure of endogenous mAAV sequences from sixteen macropodoid species. Species names are indicated at the left. Macropodidae elements are in blue, Potoroidea elements are in green, and the Hypsiprymnodontidae element is in yellow. Coloured rectangles indicate areas of significant similarity compared with a multi-way alignment virtual composite sequence (90% similarity, window length = 50 bases). Gaps not bridged by a solid line represent deletions relative to the full-length mAAV-EVE1 consensus. (c) Raw, unedited maximum likelihood inference of the mAAV-EVE1 ancestral sequence. The rep gene is in red and the cap gene is in blue. Frameshifts are indicated by vertical discontinuities. Nonsense codons are represented by an “S”. (d) Schematic depiction of putative ancestral exogenous viral sequences prior to mAAV-EVE1 endogenisation, after editing for frameshifts, stop codons, and indels (Supplementary Table 1). NS1 and NS2, putative non-structural proteins; S1 and S2, putative structural proteins; AAP, putative assembly-activating protein.

