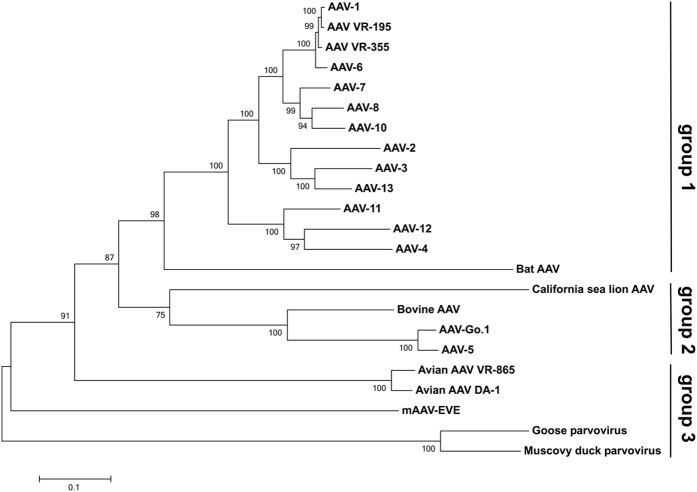
Figure 7. Phylogenetic analysis of viral genomic sequences.
The phylogenetic relationship among the inferred mAAV-EVE1 genomic sequence and twenty-two extant dependoparvovirus genomes was analysed by the Maximum Likelihood method using a GTR + Γ substitution model. The tree bearing the highest log likelihood is shown (−40249.8723). Branch support values were derived by bootstrap analysis. Number of bootstraps = 500. A midpoint-rooted tree is shown. Scale = number of nucleotide substitutions per site.

