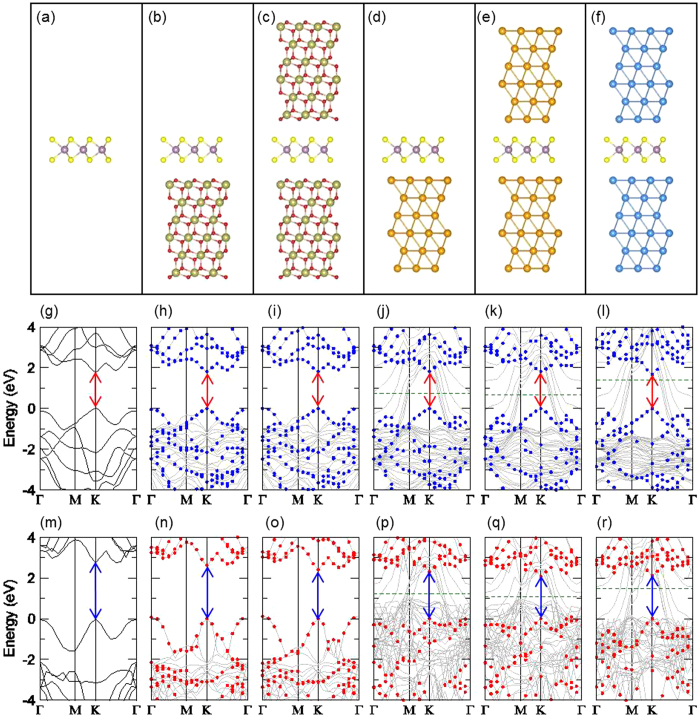
Figure 1. Atomic structures and electronic band structures.
(a–f) Atomic structures of the freestanding ML MoS2 (a), ML MoS2 on HfO2 substrate (b), ML MoS2 sandwiched by HfO2 (c), ML MoS2 on Au metallic substrate (d), ML MoS2 sandwiched by Au (e), and ML MoS2 sandwiched by Ag (f). The Mo, S, Hf, O, Au, and Ag atoms are indicated by the purple, yellow, gold, red, yellow, and blue color balls, respectively. (g–l) Calculated LDA band structures of the freestanding ML MoS2 (g), ML MoS2 on HfO2 (h), ML MoS2 sandwiched by HfO2 (i), ML MoS2 on Au (j), ML MoS2 sandwiched by Au (k), and ML MoS2 sandwiched by Ag (l). The blue filled dots (g–l) indicate the projected states to the ML MoS2. (m–r) Calculated GW band structures of the freestanding ML MoS2 (m), ML MoS2 on HfO2 (n), ML MoS2 sandwiched by HfO2 (o), ML MoS2 on Au (p), ML MoS2 sandwiched by Au (q), and ML MoS2 sandwiched by Ag (r) are shown. The red filled dots (m–r) indicate the projected states to the ML MoS2. The arrows (g–r) indicate the direct bandgap at the K valley of the ML MoS2. The Fermi levels of the Au and Ag containing systems (j–l,p–r) are indicated by the green dashed lines.

