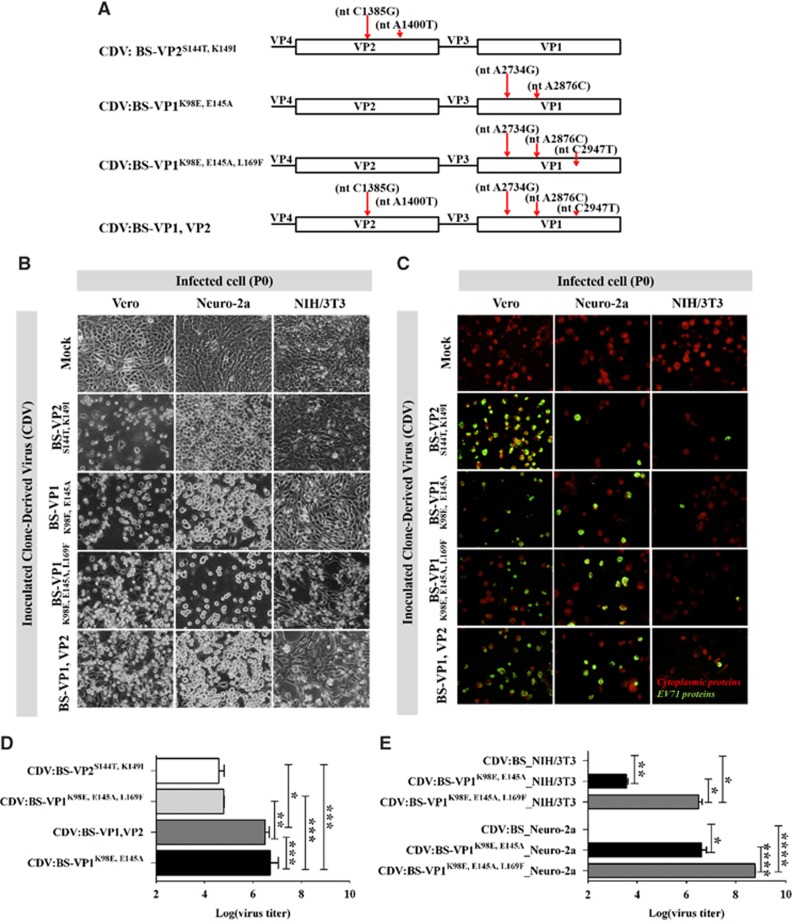
Figure 3.
Cell infection induced by CDVs with multiple amino acid substitutions in the VP1 and VP2 proteins of EV71:BS. (A) Schematic map depicting the location of the nucleotide (nt) mutations introduced into the genomes of various CDVs. (B–E) Cellular infection in Vero, NIH/3T3 and Neuro-2a cells inoculated with CDVs at an MOI of 1 was assessed by detecting virus-induced CPE (B) and viral antigens (C) at 72 h p.i. at passage 0 (P0). Live cell images were taken at × 40 magnification and are shown in grayscale. Fluorescence images were taken at × 40 magnification and are shown with enhanced contrast. Viral antigens were labeled with FITC (green), and cells were counterstained with Evans blue (red). Viral titers were also measured from Vero cells inoculated with all CDVs (D) and murine cells (NIH/3T3 and Neuro-2a) inoculated with CDV:BS-VP1K98E,E145A or CDV:BS-VP1K98E,E145A,L169F (E). Titers from all cells were measured at passage 0 (P0). Titrations were performed with dilutions of 10−1 to 10−10 in Vero cells following viral disaggregation with chloroform. The results are representative of two independent experiments. For D and E, a modified t-test with Welch's correction for unequal variance was used to compare mean values (n=4). Error bars represent the SD *P<0.05, **P<0.005, ***P<0.0005, ****P<0.0001. clone-derived virus, CDV; cytopathic effect, CPE; multiplicity of infection, MOI.

