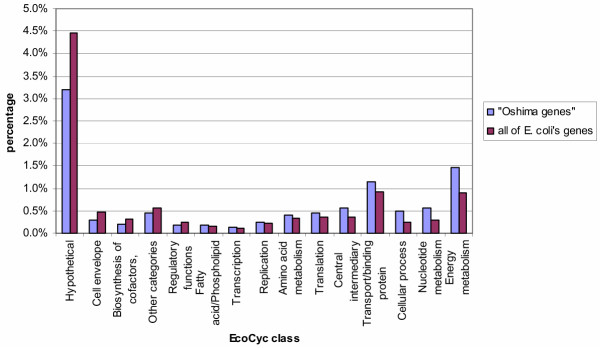
Figure 1.
Comparison of the distribution of the "Oshima genes" with all of E. coli's genes. The genes of E. coli have been classified according to the 15 classes used by EcoCyc. In this figure we compare the distribution of the genes sensitive to the dam+/ dam- background according to a transcriptome analysis carried out by [6] ("Oshima genes") with all of E. coli's genes. The distributions are different (p-value = 1.7 × 10⁻⁷): the "Oshima genes" contain a much smaller proportion of "Hypothetical" genes, whilst the group "Energy metabolism" is particularly overrepresented.

