FIGURE 1.

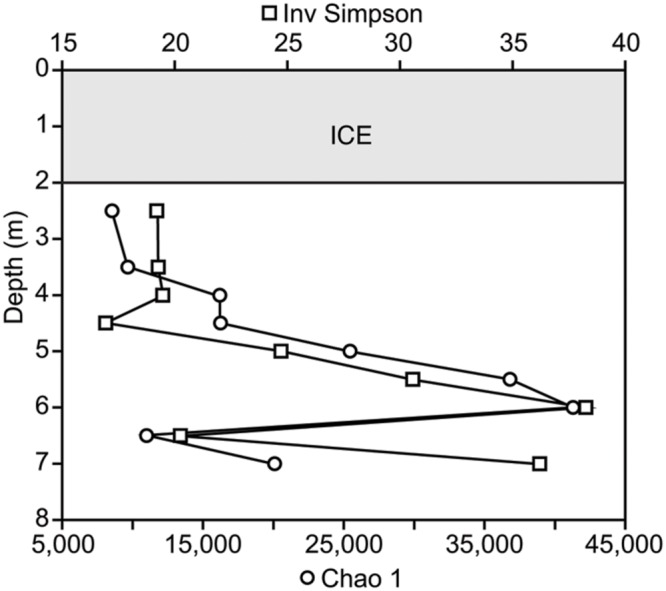
Microbial richness and diversity throughout the water column using the Chao 1 estimator and inverse Simpson index based on the number of OTUs and their relative abundances detected in each sample.

Microbial richness and diversity throughout the water column using the Chao 1 estimator and inverse Simpson index based on the number of OTUs and their relative abundances detected in each sample.