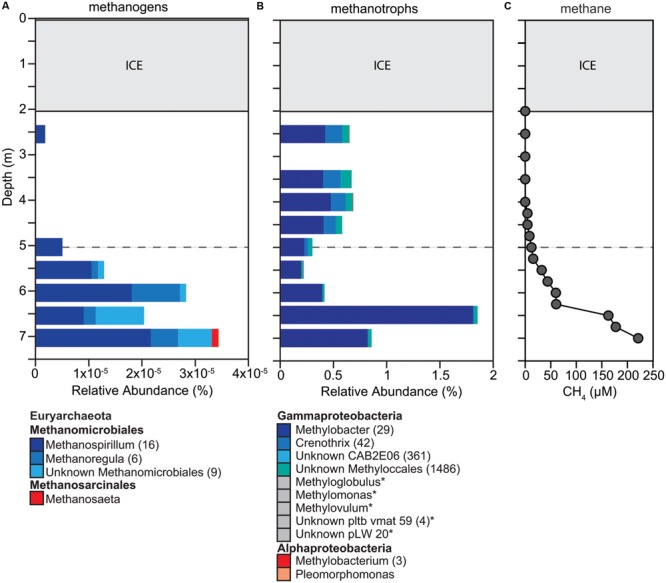
FIGURE 4.

Changes in composition of potential (A) methanogens and (B) methanotrophs down the water column, as well as (C) methane concentration throughout the water column. (A,B) We determined taxonomic identification of the 16S rRNA genes classified into OTUs for each functional group using the SILVA database. OTUs with identical taxonomic identification (99–100%) were combined into the same taxonomic group and the number of OTUs included in each taxonomic group is indicated with the number given after the taxonomic name. If no number is given, the group only contains one OTU. Taxonomic groups with abundances too low to be visible on the graph are labeled with an ‘∗’ and marked with a gray box instead of a colored box. Dashed gray horizontal line shows the oxycline at 5.0 m.
