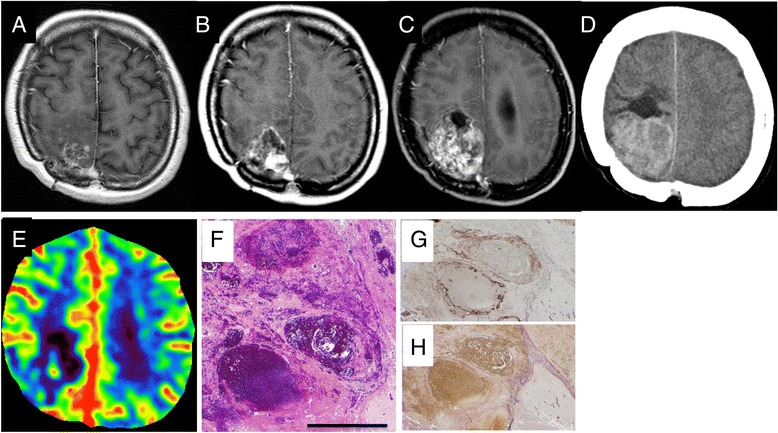
Fig. 2.

Axial contrast-enhanced MRI brain images showing a right parietal delayed radiation necrosis (15 mm) after SRS, surgery, and SRT at initiation of T-DM1 (a), (b) enlarging heterogeneous enhancement (30 mm) at 12 months (c) rapid progression of nodular lesion (48 mm) at 15 months after initiation of T-DM1 therapy. Precontrast CT scan shows high density area in this lesion (d). Perfusion CT (e) showing an area of low CBV. Photomicrographs of H-E (f), CD31 (g) and EVG (h) stains. The scale bar represents 500 μm for panel. Hemorrhage and dilated blood containing spaces are shown (f). CD31 immunostaining (g) shows vascular structures of variable sizes. However, EVG stain (g) indicates no elastic or collagenous fibers surrounding vascular lumina, in contrast to purplish-brown collagen and black elastic fibers comprising septa between hemorrhagic area (left) and viable cerebral tissue (lower right)
