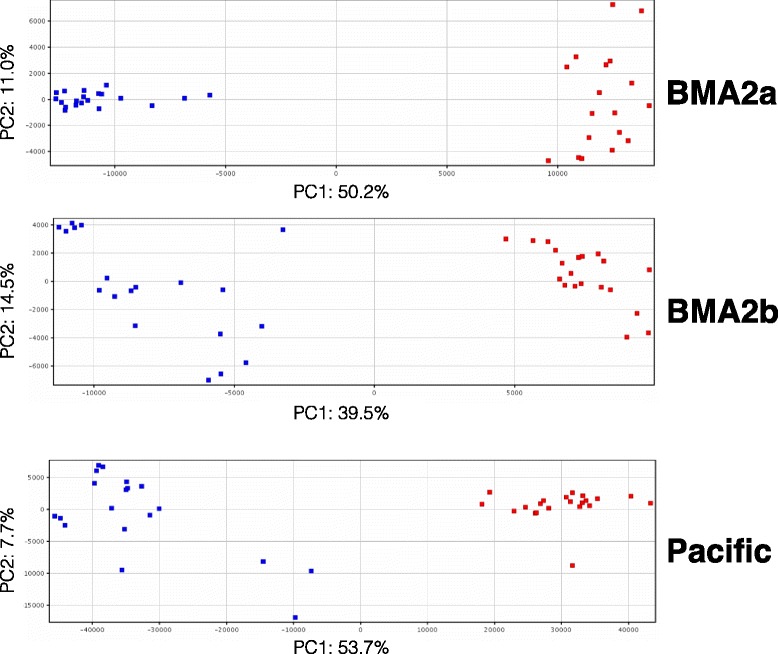
Fig. 1.

Principal Component Analysis of three populations of L. salmonis. Individual lice are represented in blue (males) and red (females). Sexes are separated on PC1 (x-axis) in all populations by 50.2 %, 39.5 % and 53.4 % for BMA-2a, BMA-2b, and Pacific lice, respectively. Only transcripts expressed by both sexes (i.e. excluding sex-specific probes) were included in PCA analysis
