
Fig. 5.
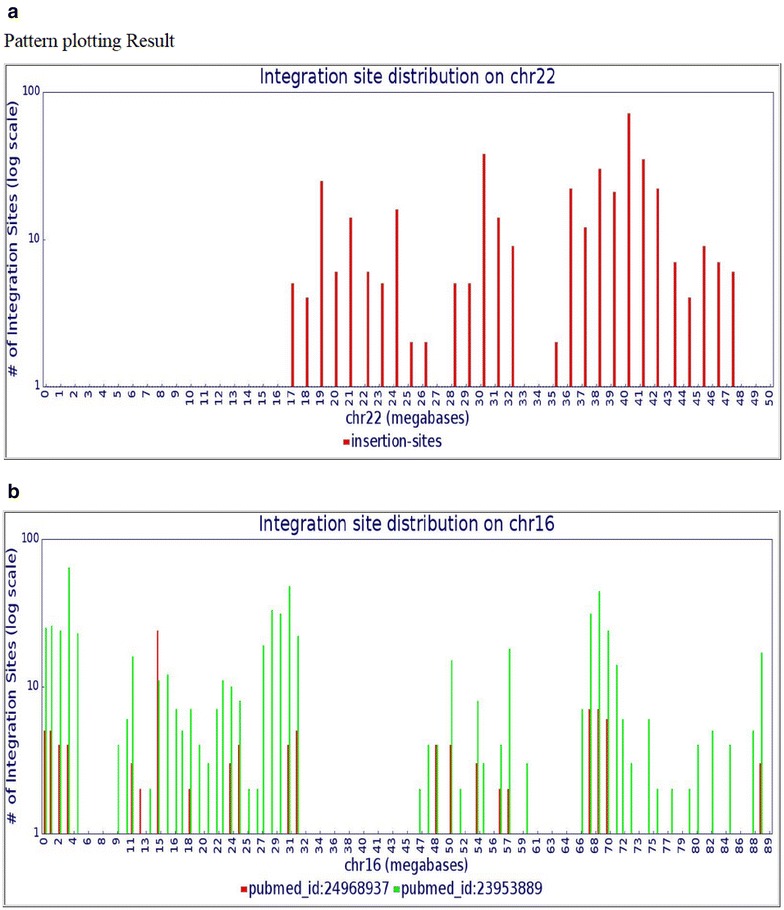
Distribution of integration sites, presented in bins of 1 million nucleotides, along a chromosome. The Y axis shows the number of HIV-1 integration sites in 1-megabase bins. The X axis shows the positions in megabases. a Distribution of all HIV-1 subtype B integration sites stored in RID for human chromosome 22. b Distribution comparison between two publications (red color: [12] and green color: [14]) indicated by PubMed IDs. The vertical arrow indicates the position of the MKL2 gene, a region of selected integration sites reported by Maldarelli et al. [12]