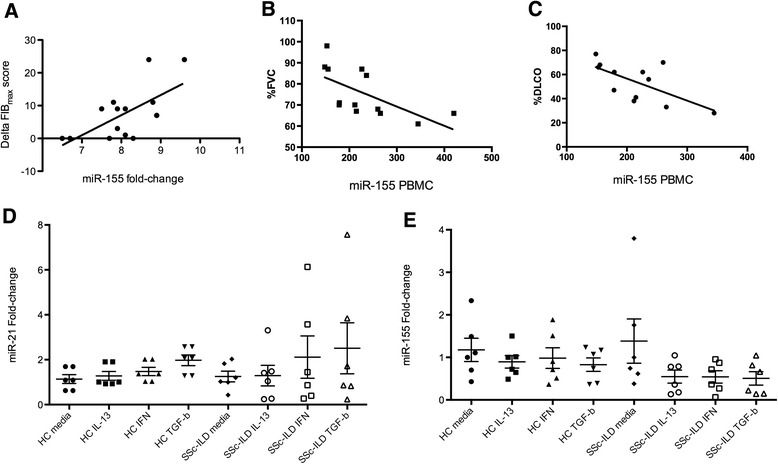
Fig. 3.

a Correlation between the delta high-resolution computerized tomography lung score (Fib Max) and mir-155 whole lung homogenate gene expression (r = 0.65, p < 0.001). b Correlation between miR-155 expression on peripheral blood mononuclear cells by Nanostring and percentage forced vital capacity (%FVC) (r = –0.60, p = 0.01), and c percentage diffusing capacity of the lung for carbon monoxide (%DLCO) (r = –0.58, p = 0.02). d miR-21 and e miR-155 expression on lung fibroblasts from cell lines of healthy controls (HC) and patients with systemic sclerosis interstitial lung disease (SSc-ILD) stimulated for 18 hours with media, IL-13, transforming growth factor-beta (TGF-β), and interferon-alpha (IFN-α) (see “Methods”) (analysis of variance, p > 0.05 for both miRNA). Data are expressed as fold-change compared to HC samples or media control on a, b, d, and e. Data are expressed as counts of gene expression and percentage on b and c. p < 0.05 was considered significant
